


ThermoSpot-Vision
17
GB
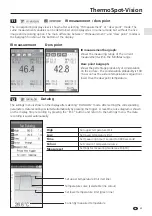
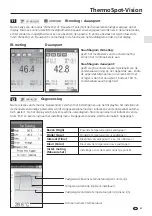
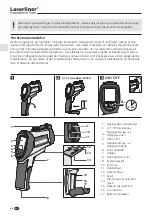
IR measurement / dew point
The corresponding display view is shown after selecting "IR measurement" or "dew point" mode. The
same measurement variables can be determined and displayed as in camera mode but without the live
image and recording option. The main difference between "IR measurement" and "dew point" modes is
the bargraph function at the bottom of the display.
IR measurement
Dew point
IR measurement bargraph:
shows the measuring range of the current
measurement within the Min/Max range.
Dew point bargraph:
shows the percentage probability of condensation
on the surface. The condensation probability is 100
% as soon as the surface temperature is equal to or
lower than the dew point temperature.
11
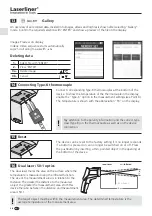
Datalog
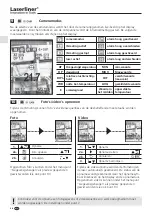
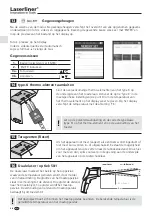
The settings menu is shown in the display after selecting "DATALOG" mode. After setting the corresponding
parameters, data recording is started automatically by pressing the trigger. A real-time curve diagram is shown
on the display. Stop recording by pressing the "ESC" button and return to the Settings menu. The data
recording is saved automatically.
12
High
Set upper temperature limit
Low
Set lower temperature limit
Time
Set measuring time (1 second to 3600 seconds)
Colour
Set colour of temperature curve
Measure set
Settings for measuring mode (see Point 8)
Set upper temperature limit (red line)
Set lower temperature limit (green line)
Currently measured temperature
Temperature curve (selectable line colour)
Summary of Contents for ThermoSpot-Vision
Page 222: ...222 ...
Page 223: ...ThermoSpot Vision 223 ...


