Models LB480A/LB680A
USB Powe™
Product Manual PPA (Pulse Profiling Application)
Revision: 08/02/11
12
4. The Elements of the Display Panel
Sensor Information
Toolbars
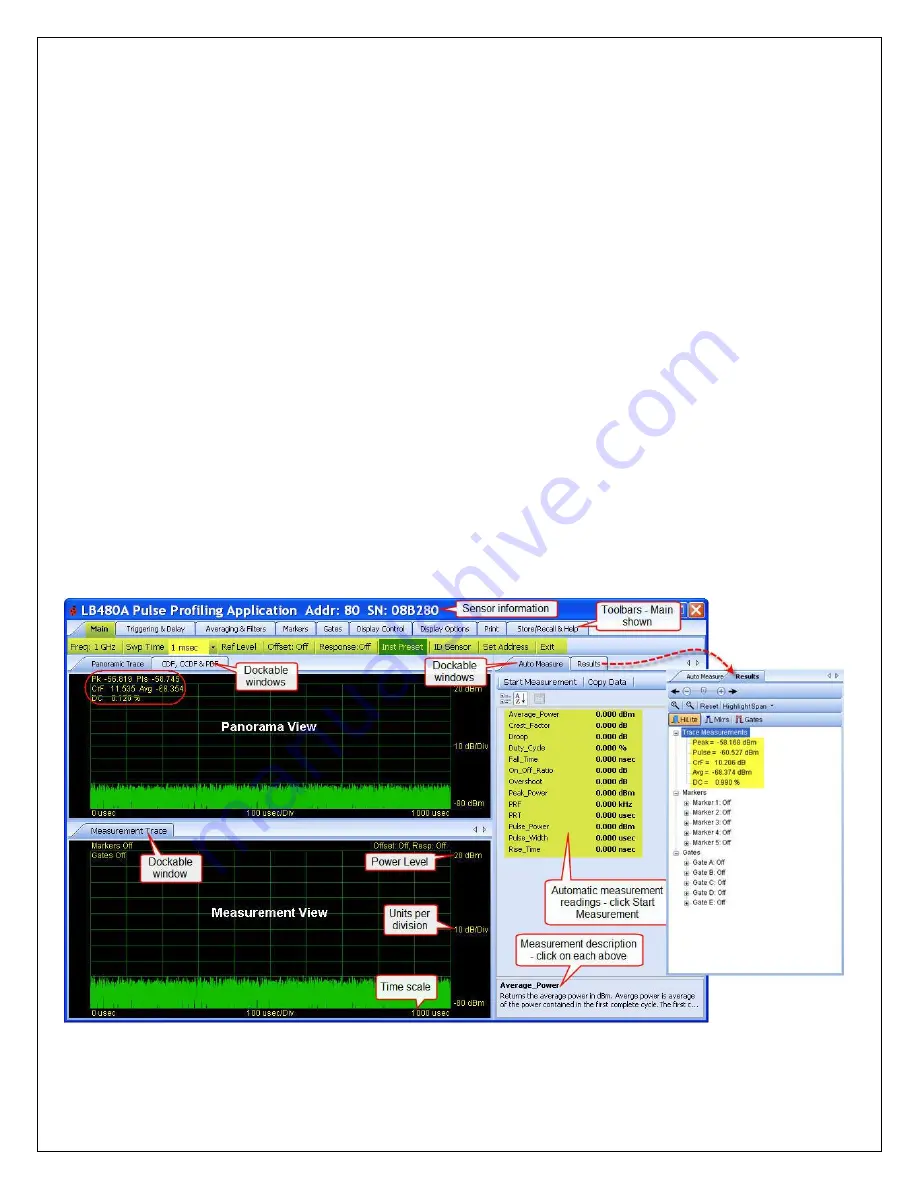
The main elements of the default display are shown below with no signal applied to the sensor. We will demonstrate
the features and functionality of the user interface in the following section of this manual
entitled “The Toolbar
Functions”. The main elements of the display are:
The Banner with sensor information
The Toolbars
The Dockable Windows (Panoramic Trace; Measurement Trace; Auto Measure; Results; CDF, CCDF & PDF)
The Banner at the top of the user interface indicates the model number of the power sensor, the unit address, and the
unit serial number. The Toolbars allow you to configure the sensor for any given measurement and provide for
housekeeping tasks. The Dockable Windows or panes give a visual presentation of the input signal to the sensor: The
top graph is called the
Panoramic Trace
and the bottom graph is called the
Measurement Trace
. You can highlight a
portion of the Panorama by clicking and dragging the cursor directly on the Panorama View. This highlighted time
segment will then appear in the Measurement View. This allows for a more detailed examination of the signal using
time markers and time gates. The
Auto Measure
pane allows you to make a comprehensive list of measurements with
a click of a button. The
Results
pane (inlay) allows you to manually setup the markers and gates for a given
measurement as we will demonstrate. The
Results
pane shows the measurement readings that include the current
trace values and the marker and gate values. The current trace values are also listed above the grid in the Panorama
View (circled). The
Results
pane provides convenient access to the tools needed to manipulate the signal display in
the Measurement view. You can scroll left and right; zoom in and out; reset or highlight the span; and select the pointer
mode. The
CDF, CCDF & PDF
pane gives you some tools for statistical analysis -
see Section 6. Statistics.
The Dockable Windows can be repositioned to maximize the display areas. We will explain the docking features next
to allow you to manage the display presentation to your liking.


