48
Log Data
Depending on the model, the data log will collect up to 13 parameters for each program
at a user-selected data rate. The Data Log Screen allows the user to sort and view up to
six sets of the collected data.
Although the Data Log Screen only allows viewing of up to six 6 parameters, all
parameters are permanently stored with the Data Log, and will be viewable when the
log file is downloaded and viewed on a computer.
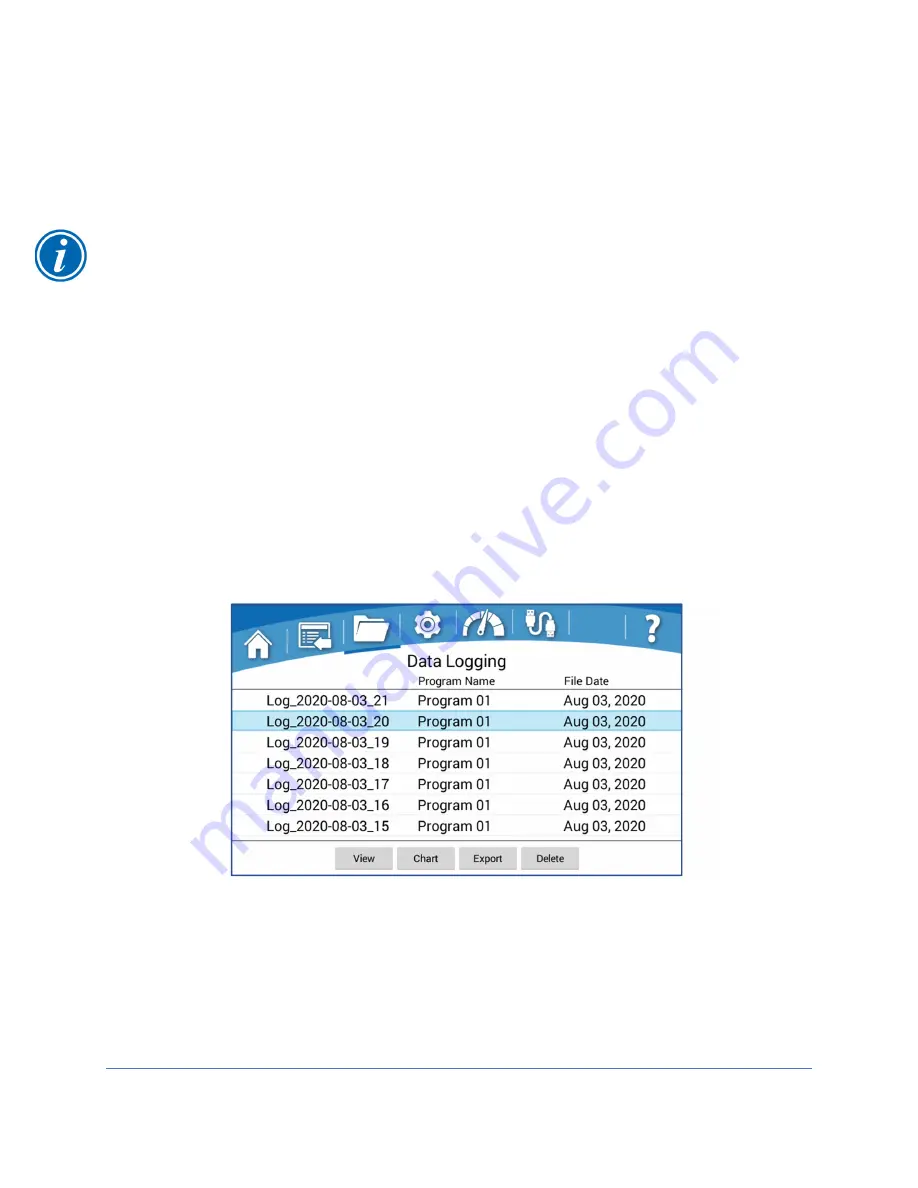
See Fig. 6-9. Each file will be named sequentially as follows “LOG_YYYY-MM-DD_XX”,
where YYYY = Year, MM = Month, DD = Day, and XX = 01 to 99 for the first through
99
th
log of that specific day. The data log default rate is 10 seconds. The default data
rate can be changed in the Settings Screen by selecting
Data Log
, and then change the
data collection rate from the drop down menu.
A data log can be selected from the list by touching the data log file name. When a data
log has been selected, the row will be highlighted as shown in Fig. 6-9. When selected,
the buttons along the bottom of the screen will activate (
[View]
,
[Chart]
,
[Export]
,
[Delete]
). If a data log is currently running (collecting data), the
Running Man
icon will
appear to the left of data log file name.
Figure 6-9
Summary of Contents for FlaskScrubber 4110010 Series
Page 101: ...101...