


Shock Dyno
Version: 1.0.23241
Page 36/62
9.8.
Graph Types
This section describes the different graph types available for each test.
Force vs Displacement
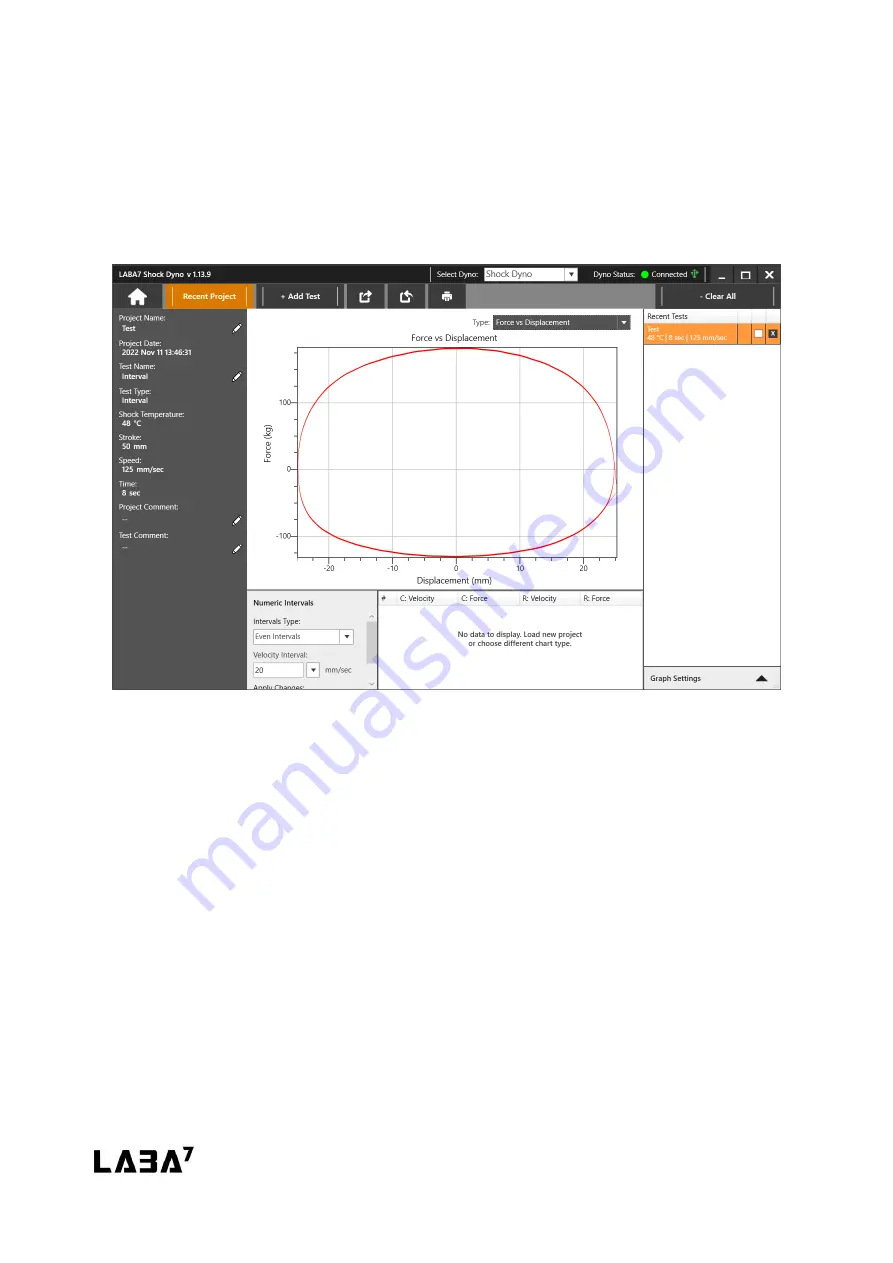
Figure 27
Force vs Displacement is a default graph presented upon launching the application. It is also used
for the live test preview whenever a test is being performed.
The horizontal axis represents the displacement. 0 indicates the middle position of the stroke.
The vertical axis represents the force. The positive force in the upper half of the graph represents
the compression cycle, and the negative force in the bottom half of the graph represents the
rebound cycle.
The left side of the compression and the right side of the rebound represents the speed-up, and
the right side of compression and the left side represents the slow-down of corresponding cycles.


