


96
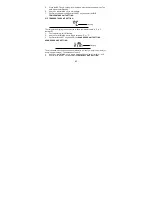
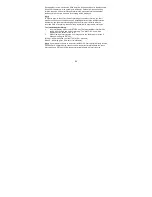
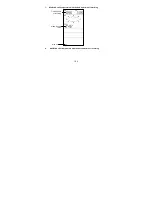
AIR PRESSURE HISTORY (ELECTRONIC BAROMETER WITH
BAROMETRIC PRESSURE TREND)
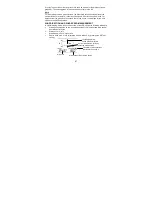
The bottom section of the LCD also shows the relative air pressure value and the air
pressure history.
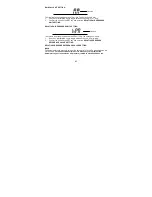
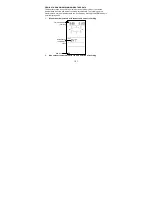
Depending on programming conditions, display of the history of air pressure in form of
a graph consisting of vertical bars.
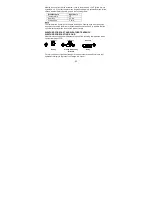
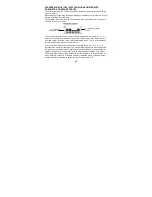
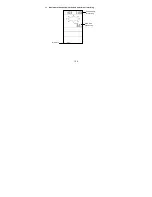
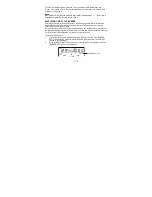
The bar graph of the electronic barometer shows the air pressure history of the past
12 hours in five 3-hour steps.
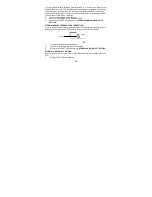
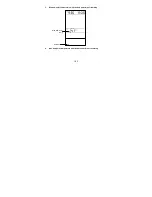
The horizontal axis represents the last 12 hours air pressure recording (-12, -9, -6, -3
and 0 hour). The bars are plotted at each of the 5 steps and give the trend over the
recorded period. The scale on the right compares the result. The "0" in the middle of
this scale determines the current air pressure.
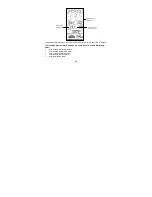
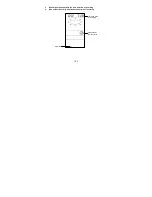
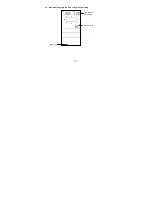
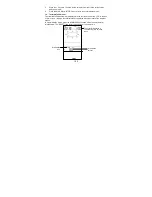
The vertical axis represents the air pressure changes in hPa (+4, +2, 0, -2, -4. “0”
represents the current air pressure). The newly measured pressure was compared to
the previously recorded pressure reading. The pressure change is expressed by the
difference between the current ("0h") and the past readings in division of ±2 hPa or
±0.06 inHg. If the bars are rising it indicates that the weather is getting better due to
an increase in air pressure. If the bars go down it indicates a drop of the air pressure
and the weather is expected to get worse from the present time "0".
Air pressure
changes in inHg
Air pressure changes
in hPa


