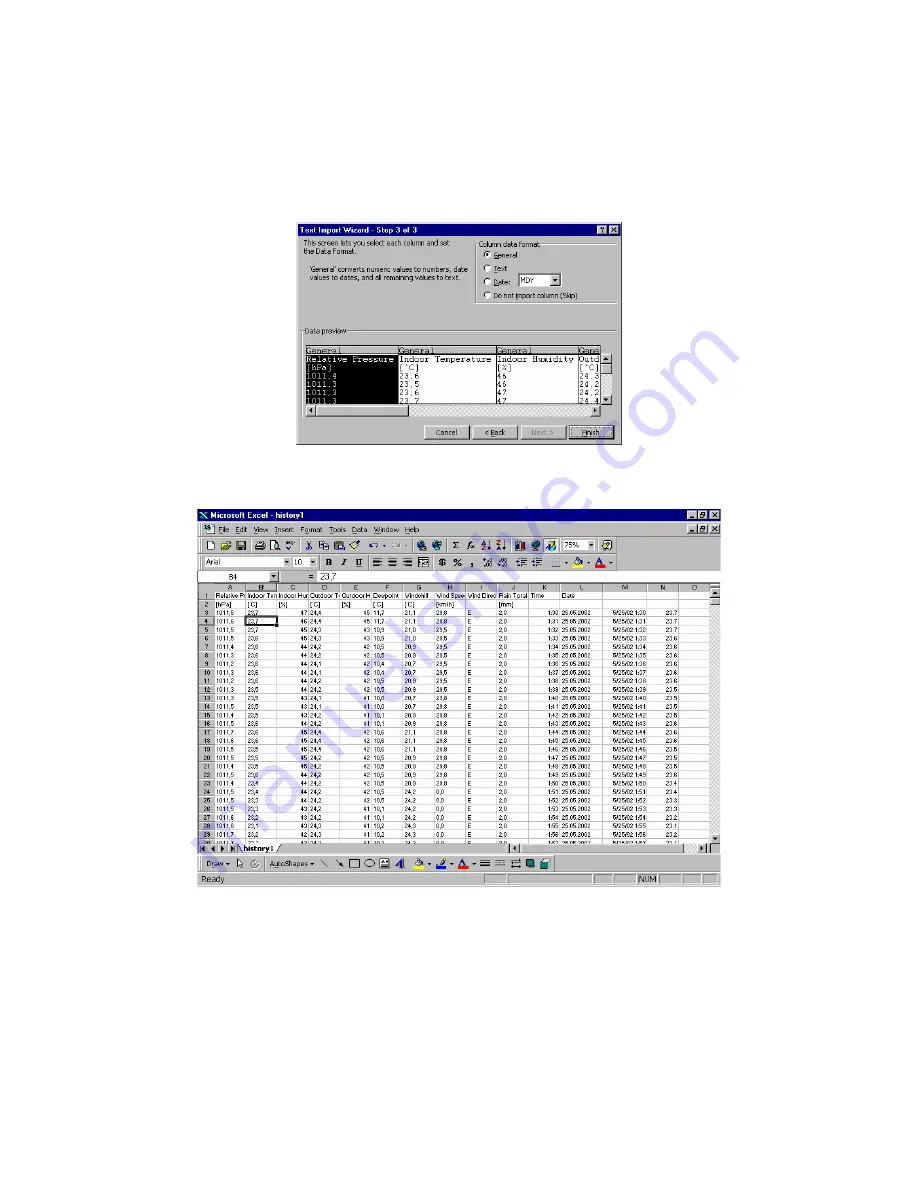
5. Next, select the appropriate data type (such as text or numbers) for each column of data. The default
setting General and this is usable and click the Finish button
6. The data is then imported into the Excel ready for the user to plot a graph. In this example we will use the
indoor temperature.