background image

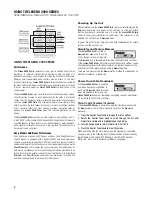
The sonar returns received by the 

L

EGEND

2000 S

ERIES

are

displayed along the depth range scale in a 

R

EAL

T

IME

S

ONAR

™ (RTS) W

INDOW

and 

C

HART

W

INDOW

. The 

RTS W

INDOW

displays new sonar information within the transducer
cone in an expanded, easy-to-see format; the 

C

HART

W

INDOW

logs old 

RTS W

INDOW

information to show a contour

view of the bottom and structure.

Real Time Sonar™ (RTS) Window
The 

R

EAL

T

IME

S

ONAR

(RTS) W

INDOW

shows instantaneous sonar
returns from the bottom,
structure and fish that are
within the transducer beam.
The 

RTS W

INDOW

updates with

new sonar information much
more quickly than the 

C

HART

W

INDOW

- up to 20 times per

second in shallow water. The

RTS W

INDOW

responds to

quickly-changing depths in a
way similar to a flasher type
sonar display. Interpreting
the RTS information requires some
skill; comparing the RTS data with the
data in the 

C

HART

W

INDOW

, however, makes

the RTS information easy to
understand. 

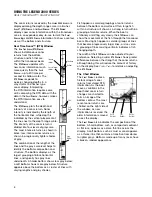
The 

RTS W

INDOW

plots the depth and

intensity of a sonar return. Sonar
intensity is indicated by the length of
the horizontal lines, while depth is
indicated by the vertical placement of
the lines next to the depth range scale.
The intensity of the sonar return is
divided into four levels of grayscale.
The most intense returns are shown in
black; less intense sonar returns are
shown in progressively lighter shades
of gray.

The combination of the length of the
lines and the gray scale level helps to
identify the bottom composition and
structure. The bottom displays as the
largest grouping of black horizontal
lines, and typically has gray lines
underneath. A harder bottom shows less gray below;
a soft bottom shows more gray below. Structure
appears above the bottom as a cluster of lines with
varying lengths and gray shades. 

Fish appear as smaller groupings of sonar returns
between the bottom and surface. Often, large fish
within a structure will show as a strong return within a
grouping of smaller returns. When the boat is
stationary or drifting very slowly, the 

RTS W

INDOW

can

show the movement of the fish through the transducer
beam. Moving fish appear as smaller groups of lines
that become progressively larger lines, or vice versa.
A grouping of lines moving vertically indicates a fish
changing depth.

The width of the 

RTS W

INDOW

can be adjusted to your

preference. Selecting a wider 

RTS W

INDOW

shows greater

differences between the strength of the sonar returns,
although doing this will reduce the amount of history
on the display. See 

C

ONTROL

P

ANELS

for details on adjusting

the 

RTS W

INDOW

.

The Chart Window
The 

C

HART

W

INDOW

creates a

historical log of sonar
returns from stored RTS
information. As the boat
moves, variations in the
depth and sonar return
changes are charted to
form an image of the
bottom contour. The most
recent sonar returns are
charted on the right side of
the window; as new
information is received, the
older information is moved
across the display. 

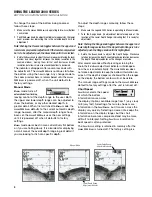
The 

C

HART

W

INDOW

also indicates the composition of the

bottom. A hard bottom, such as compacted sediment
or flat rock, appears as a dark, thin line across the
display. A soft bottom, such as mud or sand, appears
as a thicker line that contains a transition from darker
to lighter grays. Bottoms made up of many rocks have
a broken, random appearance. 

4

USING THE LEGEND 2000 SERIES

REAL TIME SONAR™ / CHART WINDOW

Hard
Bottom

Soft
Bottom

Rocky
Bottom

Chart Window

Intense
returns

Less intense
returns

Structure

Bottom

Fish

Soft
Bottom

Hard
Bottom

Summary of Contents for Legend 2000

Page 1: ...Operations Manual Operational instructions for Humminbird Legend 2000 Series including the Legend 2000 2005 2000 Deep and 2005 Deep...

Page 2: ...nbird com WARNING This device should not be used as a navigational aid to prevent collision grounding boat damage or personal injury When the boat is moving water depth may change too quickly to allow...

Page 3: ...Speed 9 Sonar View 9 Light 9 Contrast 9 RTS Window 9 Surface Clutter 10 White Line 10 Filter 10 Depth Alarm 10 Temp Alarm 11 Fish Alarm 11 Fish Sensitivity 11 Fish ID 11 Simulator 11 Units 11 Language...

Page 4: ...SITIVITY and FISH ID provide advanced signal processing to identify fish and show their depth and relative size from either beam Powering Up the Unit After installation turn the LEGEND 2000 SERIES on...

Page 5: ...L knob again If no adjustments are made after a few seconds the CONTROL PANEL list is removed automatically Range Knob The RANGE knob adjusts the depth ranges used on the display The RANGE knob has sl...

Page 6: ...ft bottom shows more gray below Structure appears above the bottom as a cluster of lines with varying lengths and gray shades Fish appear as smaller groupings of sonar returns between the bottom and s...

Page 7: ...00 SERIES is also capable of showing layers of water having different temperatures These temperature differences called thermoclines appear at different depths depending on current conditions A thermo...

Page 8: ...SETTING READOUT shows the status when CONTROL PANEL is not selected To select a CONTROL PANEL feature for adjustment follow these steps 1 Press the CONTROL PANEL knob A list of options appears on the...

Page 9: ...r of the CHART WINDOW 3 Turn the RANGE knob clockwise until the second return is visible on the display 4 To return the depth range to normal viewing rotate the RANGE knob counterclockwise until the d...

Page 10: ...etail if you are looking for fish at a specific depth To adjust the depth ranges manually follow these steps 1 Make sure the Legend 2000 Series is operating in Manual mode 2 Push the Range knob An adj...

Page 11: ...T setting is retained in memory after the unit is turned off as long as it is set between 6 and 10 The factory setting is 8 RTS Window RTS WINDOW selects the width of the window dedicated to REAL TIME...

Page 12: ...mittently until the boat moves to deeper water The DEPTH ALARM can be muted by pressing the CONTROL PANEL knob once muted the alarm will not sound again until the boat moves to water deeper than the D...

Page 13: ...f The factory setting is 0 Fish ID FISH ID Deep Models only uses advanced signal processing to evaluate further any sonar return between the surface and the bottom If the return meets certain addition...

Page 14: ...with proper operation These bubbles dissipate with time or you can wipe the face of the transducer with your fingers after the transducer is in the water Heat Damage Never leave the LEGEND 2000 SERIE...

Page 15: ...ERIES will work reliably in water 2 6m or deeper Remember that the depth is measured from the transducer not necessarily from the surface of the water 5 The unit comes on before I press POWER and won...

Page 16: ...the exclusion of incidental or consequential damages so the above exclusions may not apply to you You may also have other rights which vary from state to state A separate Warranty is provided by inter...

Page 17: ...purchase Return product freight prepaid to Techsonic Industries Inc using an insured carrier with delivery confirmation For OUT OF WARRANTY service complete the following steps Obtain a Repair Author...

Page 18: ...g Frequencies 50 200 kHz Power Output 4000 Watts Peak to Peak 500 Watts RMS Area of Coverage 20 and 74 at 10 dB Power Requirement 10 20 VDC Display 16 level FSTN Grayscale LCD LCD Matrix 240 H x 240 V...

Reviews: