THT8
EN - 9
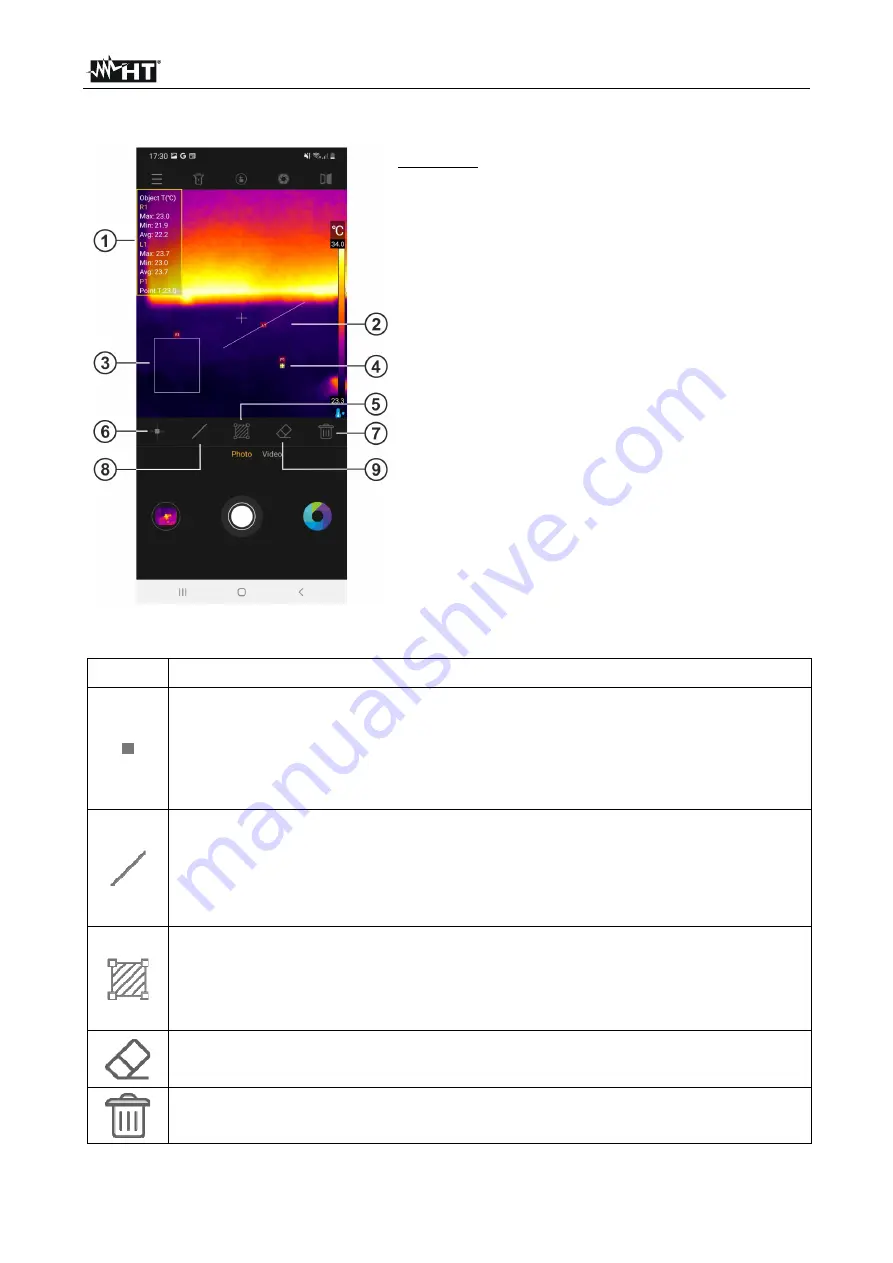
5.5 ADVANCED ANALYSIS SECTION
CAPTION:
1. Object temperature information on image
2. Line on Image object
3. Area object on image
4. Point object on image
5. Manual instrument calibration
6. Added Point on image
7. Deleting all objects on the image
8. Adding Line on Image
9. Deletion of the last object on the image
Fig. 7: Visualization of the advanced analysis section
Icon Description
Tap this icon to add a Measure Point (Px) on the image (
max 5 points)
that
can be dragged to each position. The message "Add point" appears for a
moment. The temperature associated with the point is shown at the top of the
screen (see Fig. 7 – part 1) and varies dynamically at displacement
Tap this icon to add a Measurement Line (Lx) on the image (
max 4 lines)
that
can be edited and dragged to each position. The message "Add line" appears
for a moment. The Min, Max and Average temperatures associated with the
points of the line are shown at the top of the screen (see Fig. 7 – part 1) and
vary dynamically with each movement
Tap this icon to add a Measurement Area (Rx) on the image (
max 2 areas)
that can be edited and dragged to each position. The message "Add area"
appears for a moment. The Min, Max and Average temperatures associated
with the inner points of the area are shown at the top of the screen (see Fig. 7
– part 1) and vary dynamically at displacement
Tap this icon to delete
the last
object placed on the image
Tap this icon to erase
all
objects placed on the image


