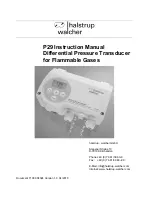
Concentration Curves
41
Conductivity
[mS/cm]
1600
1400
1200
1000
800
600
400
200
0
0
5
10
15
20
25
Concentration [% by wt]
Concentration calculation error [% by wt]
< 0.2
100 C
°
90 C
°
80 C
°
70 C
°
60 C
°
50 C
°
40 C
°
30 C
°
20 C
°
10 C
°
0 C
°
Fig. 14
Concentration curves NaOH (configuration: concentration -03-)
Summary of Contents for APT2000 Series
Page 35: ...Certificate of Conformity 35 Type Examination Certificate ...
Page 36: ...Certificate of Conformity 36 ...
Page 37: ...Certificate of Conformity 37 ...
Page 47: ......