G
B
15
G
B
14
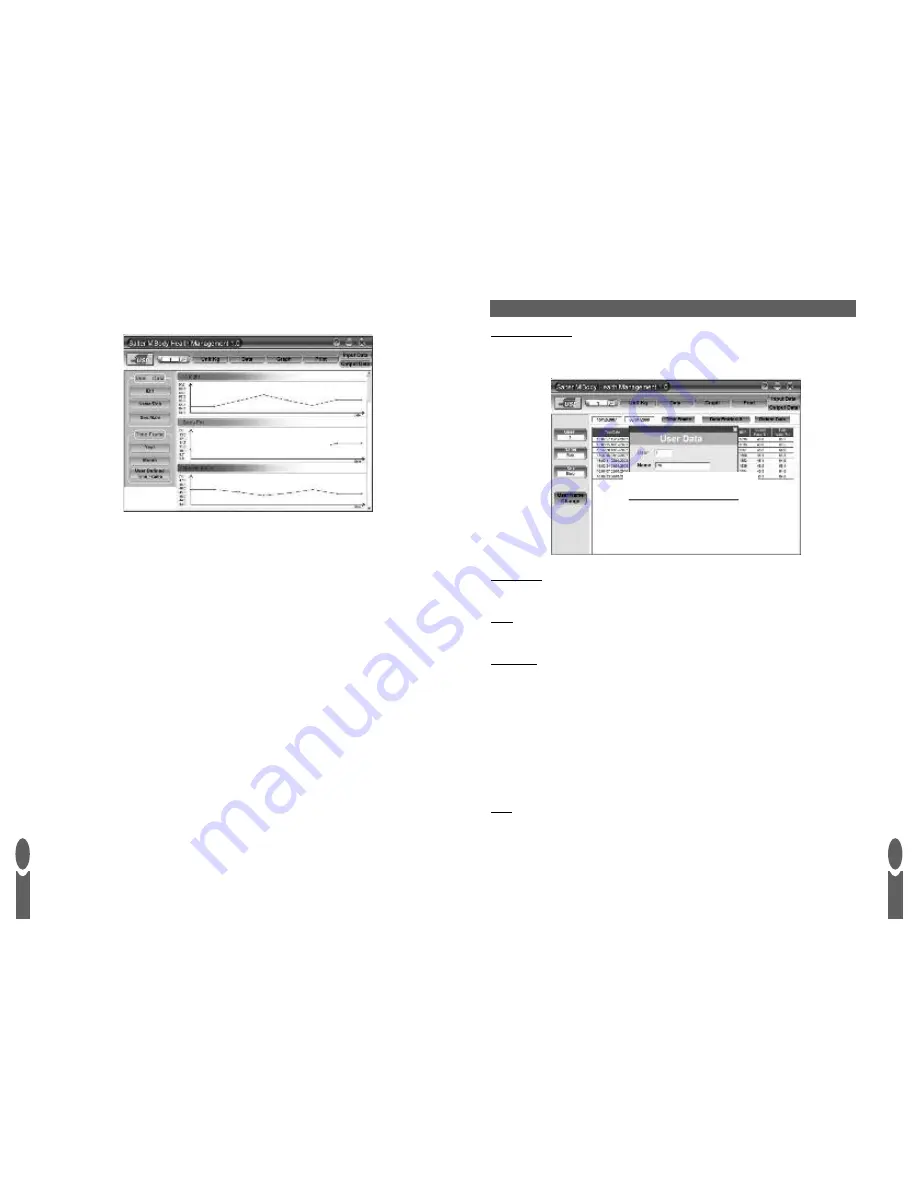
6. Click the
Graph
tab to view the results as graphs. Use the bar on the right of the window to
scroll through the different graphs.
7. To return to table mode click on
Data
tab.
8. Close the window to exit HoMedics Body Manager software.
Tip:
In graph mode click on the red points on the graph lines to view the result and date for that
point.
Note:
After you close the HoMedics Body Manager software the results are retained until the next
session. However we also recommend that you make regular backups of your results.
Data Entries
While in table mode the
Data Entries
tab indicates the total number of results you have stored.
Units
Click
UNIT
tab to change to st, kg or lb weight mode.
Timeframe
You can set a start and end date so that only results between those dates are displayed. In table mode
click on the
Timeframe
tab above the table. In graph mode click on the
User Defined
Timeframe
tab on the left of the window.
In graph mode you can also use the
Year
and
Month
tabs to limit the results displayed to a specific
year or month.
To view a single year click on
Year
. Adjust the year accordingly. Click
Year
again to confirm and
update the graphs.
To view a single month click on
Month
. Adjust the year and month accordingly. Click
Month
again to
confirm and update the graphs.
To cancel
Timeframe
click on the magnifying glass icon and select your user again.
When in table or graph mode click on the
tab to print your table or graph results.
MANAGING YOUR RESULTS
User Name Change
You can add your name to a user number by clicking on the
User Name Change
tab when in
table mode.
Need new image
Need new image


