background image


30


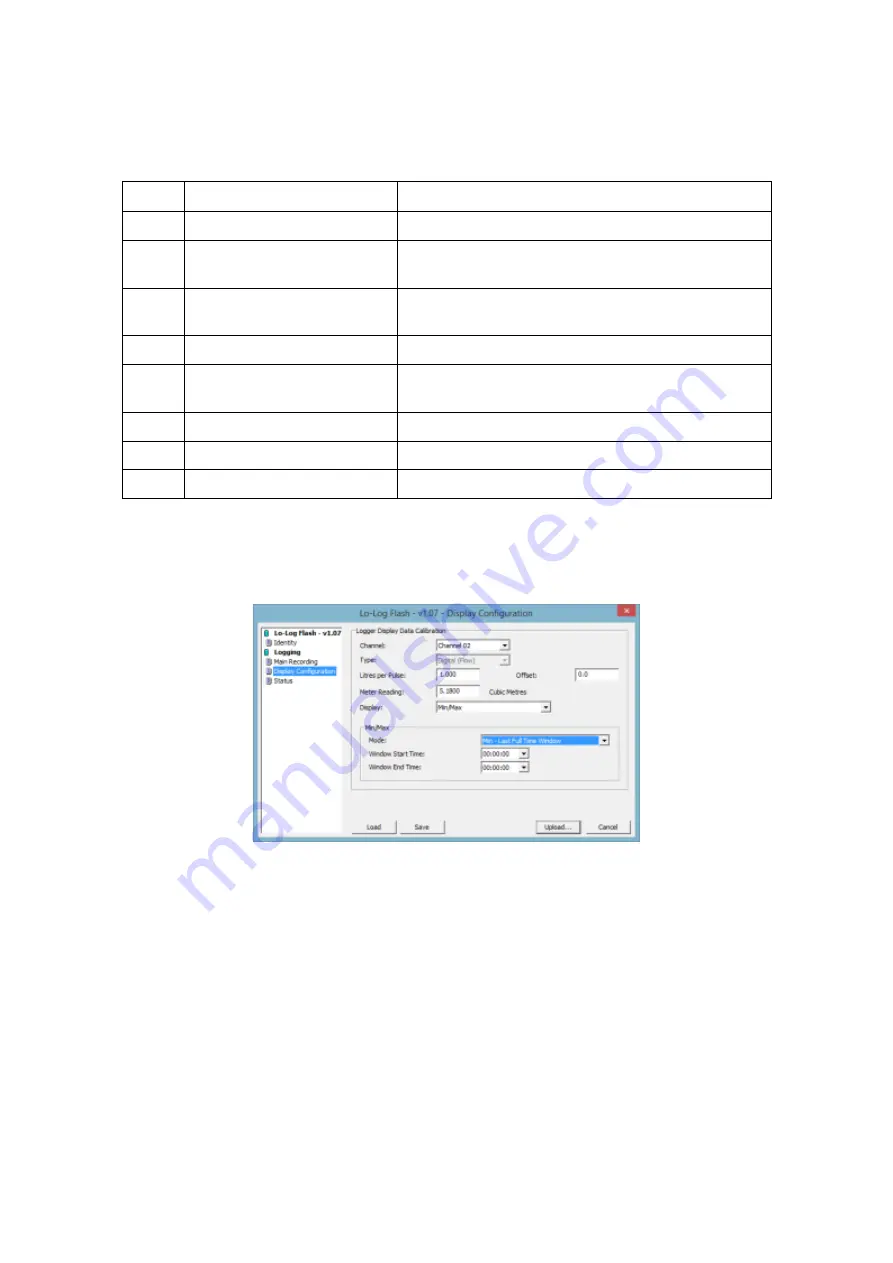
The user can select different values to be displayed on the Logger LCD screen by 
selecting  the  required  option  from  the 

Display

  drop-down  list.  A  summary  of  the 

display options is shown in the table below. 

Lo Log Vista Display Options 


OPTION 

DISPLAY 

OFF 

Displays time of day only 

VALUE 

Displays time of day, channel number and the 

latest value of the selected channel 

TOTAL 

Displays time of day, channel number and the 

total flow volume for the selected channel 

VALUE & TOTAL 

Displays 1, 2 & 3 

MIN/MAX 

Displays the minimum or maximum value during 

the last 24 hours 

VALUE, MIN/MAX 

Displays 1, 2 & 5 

TOTAL, MIN/MAX 

Display 1,3 & 5 

TOTAL, VALUE, MIN/MAX 

Displays 1, 2, 3 & 5 

Note 

For analogue pressure channels the 

TOTAL

 option is not used. 

MIN/MAX  Value  - 

The  min/max  value  is  calculated  during  either  the 

Last  Full  Time 

Window

 (start of logging and end hours set by user) or 

Within the last 24 hours from 

last 1 hour boundary 


The 

Last Full Time Window

 min/max value is calculated during the Window Start 

Time and the Window End Time. To set the Last Full Time Window select the start 
and end hour value from the 

Window Start Time

 and 

Window End Time

 drop-down 

lists (see 

Error! Reference source not found.

 below). 


The 

Within last 24 hour from last 1 hour boundary

 value is calculated during the 

latest 24 hours. 

Summary of Contents for LoLog 450 Series

Page 1: ...logger Basic User Manual for Installation and use LoLog LL 500 Vista LoLog 450 Version 1 2 Warning This manual contains important safety and operating information Please read understand and follow the instructions in the manual ...

Page 2: ...WNLOADING DATA FROM THE LOGGER AND VIEWING RESULTS 22 Download Data Wizard 22 Graph and Data Table Manipulation 24 Selecting the Input Channel Data to be viewed 25 Changing the Information in the Data Table 25 Changing the Graph Style 26 LOLOG VISTA DISPLAY OPTIONS 27 Analogue Channels 29 Digital Channels 31 Meter Reading 31 MIN MAX Value 32 FLOW INPUT 33 MILLIAMP INPUT 33 TECHNICAL SPECS 35 LoLog...

Page 3: ...2 APPENDIX ADDITIONAL INFORMATION 36 Troubleshooting 37 Installation checklist 37 Pulsers 38 Meters Pulse Value Guide 40 Meters used in conjunction with Cyble pulse units 42 ...

Page 4: ...eeding to site for physical installation please take the time to configure your logger in an office environment Most settings can be configured before visiting site and this will save time at the point of install especially if the weather is bad You will need to have A PC with Windows 7 8 installed Radwin also supports Windows XP Vista A USB to Serial adaptor if required to use with serial IR read...

Page 5: ...o run the installer 3 Now click Radwin from the Installer Click to install Radwin software Note Radwin Lite is only for specialist use The I R Driver is normally installed automatically however in case it does not in step 0 below please click the USB I R Reader Driver after the main installation is complete 4 When prompted by the InstallShield Wizard to install ...

Page 6: ... the terms of the Licence agreement to continue Click the I accept radio button then Click Next 6 Choose the Destination folder you wish to install to by clicking Change or to accept the default installation recommended click Next ...

Page 7: ...to Check with your IT team if you are not sure 7 The installation process now has all the information it needs to proceed so click Install to continue Wait while the installation completes and the I R Driver installs 8 Finally click Finish to close the InstallShield Wizard ...

Page 8: ...ograms and find the program group Radlog for Windows 2 Click Radlog for Windows to expand the group and then click Radcom View You may wish to Pin the program to your taskbar for convenience To do this right click on the Radcom View icon and select Pin to Taskbar from the pop up menu The program can now be conveniently started from the taskbar 3 After the program starts you will be automatically p...

Page 9: ...8 ...

Page 10: ...rompted later on to decide how the 7 digits are allocated E g ZZ LLLLL means you can have up to 99 zones with 99 999 loggers in each zone or ZZZ LLLL gives 999 zones with 9 999 loggers in each and so on In this way you can develop an indexing method to allow you to quickly find sites you wish to examine 4 From the Logger Identity Selection Method choose the option as described above If you wish to...

Page 11: ...the USB plug to a spare USB port on your computer or the Serial plug to a spare Serial port on your computer 2 Position the reader head on the logger as shown below Take care to position the head over raised ring area around the window The reader head will hold onto the logger by magnets in the ring around the window and this helps with positioning 3 Start Radcom View again unless already running ...

Page 12: ...11 4 The menu below shows details all the setup functions available to Radwin for the Communications port configuration click the Manual Call item from the list ...

Page 13: ... to Serial adaptor cable If you are using a Desktop computer or a Laptop with a docking station you may also see a Communications Port This is also a valid choice for your Direct Cable Port however there is usually more than one so check the physical indication by the socket on the back of the computer Tip If you are using a USB connection you can check you have the right one as follows i Look dow...

Page 14: ...13 6 There is no need to configure any other ports for this type of logger Click OK to save the configuration 7 Congratulations you are now ready to begin configuring your new data logger ...

Page 15: ...From the menu click the button to launch the programming Wizard 3 Radwin now needs to know the type of logger you are using You can either select this from the Logger Type drop down menu LoLog Flash or click the Auto Detect button to allow Radwin to discover the type automatically Then click Next to continue 4 You need to tell Radwin how the logger is currently connected to the computer As you are...

Page 16: ...ur logger a unique identity Enter the details in the four fields according to your chosen Zone and Location plan as described on page 9 and then click Next 8 You now need to define how the logger will transfer its data for downloading For this logger it will be by Direct Cable so click Next to continue 9 You now need to configure the channels 1 channel per signal sensor that you wish to use ...

Page 17: ... details on other variants or if you experience problems please contact HWM support cservice hwm water com 10 The Channel 01 configuration menu appears as below Click Next to continue 11 The Channel 02 configuration menu appears as below Again tick the Enabled box to switch the channel ON 12 As you are configuring a Digital pulse input you need to configure the number of Units Per Pulse to match t...

Page 18: ...were counted over the 15m sample rate set above this equates to 1 pulse sec and if you have set 10ltr pulse in step 12 then the final result is 10litres sec For an analogue input e g pressure depth etc the logger takes a background measurement every 30 seconds or the sample rate whichever is smaller This background measurement is then averaged across the sample period selected So if you set a 15m ...

Page 19: ...ing when you upload it it is not possible to set a start time and or date in the future Check the time date here are before the current time date If you wish to Stop recording at a specific time tick the Enable Stop box and enter the time you wish to stop recording data here Check your configuration in the summary box Click Previous to return through the menus to make any corrections Programming w...

Page 20: ... will then appear in the Zero column of the Re Zero Logger screen Allow the raw Numbers in the Zero column to stabilize Click on the Accept this ZERO VALUE button when the Zero figure values are acceptable The Re Zero Options screen will then appear allowing the operator the choice of either storing re zeroing or aborting the Re Zero by clicking into the Channel Options box and clicking on the OK ...

Page 21: ...the Store New Values box is checked the Store the new Zero Value screen appears Click on the YES button to store the values Click on the YES button to restart the logger Click Finish and the Wizard will close ...

Page 22: ...le Ch1 reading Pressure in Meters Head and Ch2 reading water Flow in Litres Sec The reading taken is the average over the sampling period specified so in our example the last value is 30 16m and 22 0l s over the last 15m So if you have just connected your logger you may have to wait a few minutes for the reading to stabilise The value in the square brackets 301 5 is the raw uncorrected value being...

Page 23: ...connection to the logger Direct RS232 and the Baud Rate 9600 Next This is similar to the procedure used to configure the logger After making the above selections the Download Data screen will appear Download Data The logger is about to be downloaded If the download fails check the logger is connected to the computer as specified and the connection configuration is correct Click the Next button for...

Page 24: ...he logger if changes are required Proceed through the logger configuration screens until you arrive at the Data Filename screen Data Filename The Data Filename screen assigns a filename for the data to be stored but allows the operator to insert a text comment into the Comment field i e date of transfer logger identity that will be stored as part of the file Store Data The recorded data will now b...

Page 25: ...layed as a graph and data table Graph and Data Table Manipulation The graph and data table can be manipulated to display information for either channel The type of graph and the format of the displayed data can be altered either by using the drop down menu the toolbars or by right clicking on the mouse Note An easy to use Help Menu is opened by default and contains all the necessary information to...

Page 26: ...quired channel from the Graph Select option Changing the Information in the Data Table The information that is displayed in the data table below the graph can be changed to show Cursor Values Tabular Data Data Summary or Graph Statistics The cursor values option displays the value for each graph while the other options display the values for the selected channel The information in the table can be...

Page 27: ... Open CSV File MS Excel Writes the contents of the tabular data table to a temporary CSV file that is automatically opened using the default CSV file viewer normally MS Excel Open TXT File Writes the contents of the tabular data table to a temporary TXT file that is automatically opened using the default TXT file viewer Changing the Graph Style The operator can change the style of the graph view t...

Page 28: ...splays graphs with data points as joined lines Filled Line Same as Line but fills the area under the graph 3D Line Same as Line but with a 3D effect Bar Each data point is displayed as a bar 3D Bar Same as Bar but with a 3D effect Remove Graph Removes the current graph indicated as the top most graph title above the graph Remove All Graphs Removes all displayed graphs Export Data Allows an export ...

Page 29: ...und Select the Download Parameter Settings for Last Recording option by clicking in to the check box Click on the OK button The below screen will appear to show that the logger parameter settings for the last recording are being downloaded to the PC PDA When the parameter settings have been downloaded the Lo Log Flash Parameters screen will appear Select the Display Configuration tab on the Lo Log...

Page 30: ...a in memory raw number R x unit per pulse N offset O D R x N O A standard logger fitted with internal pressure sensor is calibrated over a 10 bar range and stores data in memory in units of decimetres To display values in different measurement units on the LCD for a standard pressure channel select the Units per Pulse value from the table below the Offset value will always be 0 LCD DISPLAY VALUE U...

Page 31: ...ing the last 24 hours 6 VALUE MIN MAX Displays 1 2 5 7 TOTAL MIN MAX Display 1 3 5 8 TOTAL VALUE MIN MAX Displays 1 2 3 5 Note For analogue pressure channels the TOTAL option is not used MIN MAX Value The min max value is calculated during either the Last Full Time Window start of logging and end hours set by user or Within the last 24 hours from last 1 hour boundary The Last Full Time Window min ...

Page 32: ...ment unit the values from Error Reference source not found assuming he flow meter sensor generates 1 pulse for 1 litre of water will need to be input into the Litre per Pulse field LCD DISPLAY VALUE LITRES PER PULSE OFFSET Litres Second 1 0 Litres Minute 60 0 Litres Hour 3600 0 Meter3 Hour 3 6 0 Note The display will continuously loop round the selected information from the chosen options shown in...

Page 33: ...n to select the upload options from the Upload Parameter screen shown below Check the General Parameters and Main Recording Restart boxes under the Options and click OK The following screen will appear to indicate the parameters are being uploaded When uploading is complete the Display Configuration Tab on the Lo Log Flash Parameters screen reappears The user can check the options that have been s...

Page 34: ...irection input signal 0V VE direction Yellow Digital Flow Input Circuit MilliAmp Input 4 Pin MilliAmp Milspec Connector Pin No Title Description Typical Radcom Milliamp cable colours A B VE signal Positive mA input signal Blue C D VE signal Negative mA input signal Yellow 1 2 3 VSS VDD Maximum frequency 64Hz Minimum pulse width 8mS Logger input ciruit FLOW DIRECTION Open collector 2 1 Contact clos...

Page 35: ...34 MilliAmp Input Circuit Logger mA input ciruit GND B VDD D 4 20mA transmitter ...

Page 36: ...hase as changes cannot be made after manufacture Logging Features Frequency Sample periods In 1 second increments from 1 to 60 seconds Then 1 minute increments from 1 to 60 minutes Then 1 hour increments from 1 to 24 hours Logger ID Up to 7 alphanumeric characters Site ID Up to 127 alphanumeric characters Clock On board 24 hour real time clock with date facility Logging Modes Count and Event PIT l...

Page 37: ...ity of data Please note that the correct configuration must be ordered at the time of purchase as changes cannot be made after manufacture Logging Features Frequency Sample periods In 1 second increments from 1 to 60 seconds Then 1 minute increments from 1 to 60 minutes Then 1 hour increments from 1 to 24 hours Logger ID Up to 7 alphanumeric characters Site ID Up to 127 alphanumeric characters Clo...

Page 38: ... Logger records zeros Check connections for ingress of water or trapped moisture Check sensor for correct operation Check sensor lead for damage When downloaded flow rate readings from the logger are unexpectedly negative The meter sensor combination is producing an output frequency that is too high If possible reduce the logger sample period or change the sensor to one with a lower resolution Ins...

Page 39: ...ular meter is not shown below please contact your meter supplier for connection details Picture Pulse Cable Alternatives HWM Cable Red Blue Blue Green Red Brown Blue Black White Green Red Brown Blue Black White Green Red Brown Red Blue Black White Blue Green White Blue Brown Green Yellow Yellow Brown White Brown Blue White Green Blue Blue Green Green Red Brown Blue Black White Green Red Yellow Blu...

Page 40: ...ferent varieties of meters in use Below is a selection of water meters with their appropriate pulse calibration factors that may Assist in setup If your particular meter is not shown below please contact your meter supplier for pulse factor details ...

Page 41: ...itre per Pulse for logger PSM Meter register with 4 RED digits cal 0 5 PSM Meter register with 2 RED digits cal 50 3 RED digits cal 5 MSM Black 1 MSM Grey 1 Scocam Schlumberg See label On screen for pulse value Sappell 1 Sensus HRI A3 1 ...

Page 42: ...Fitted at position 0 01 Cal 10 0 1 Cal 100 1 Cal 1000 Helix 4000 Above 150m m Fitted at position 0 01 Cal 10 0 1 Cal 100 1 Cal 1000 Helix 3000 Up to 100m m PD10 Or LRP 10 Helix 3000 Above 150m m PD10 Or LRP 100 Helix 2000 Up to 100m m PD10 Or LRP 10 ...

Page 43: ...Above 150m m PD10 Or LRP 100 Helix 2000 Master 40mm PD10 Or LRP 1 Helix 2000 Master 50 80 100 PD10 Or LRP 10 Actaris Flostar M See table 1 Actaris Woltex See table 1 Meters used in conjunction with Cyble pulse units ...

Page 44: ...r type Size s mm Aquadis 15 20 25 30 40 1 2 5 10 25 100 1000 65 10 25 100 250 1000 10000 Flostar M All 10 25 100 250 1000 10000 Woltex 50 65 80 100 125 10 25 100 250 1000 10000 150 200 250 300 100 250 1000 2500 10000 100000 400 500 1000 2500 10000 25000 100000 1000000 Isoflo Combination Main 50 65 80 100 10 25 100 250 1000 10000 150 100 250 1000 2500 10000 100000 Isoflo Combination Bypass All 1 2 ...

Page 45: ... Kingdom 44 0 1633 489479 http www hwmglobal com MAN 110 0001 C LoLog 450 500 Installation User Guide HWM Water Limited This document is the property of HWM Water Ltd and must not be copied or disclosed to a third party without the permission of the company Copyright reserved ...

Reviews: