background image

LAB-X5000 Series User Guide


 Standards can be certified reference materials, samples that have been 

5.4.3.2.

well-analyzed using another analytical technique, or synthetics. 


Using the chosen standards, a calibration can be derived by specifying the instrument 

5.4.4.

measurement conditions, then measuring  the standards and performing regression 
calculations, which may involve instrument or matrix corrections. 


Once a calibration has been established, it can be saved for future recall and analysis, 

5.4.5.

or can be exported to another LAB-X instrument. 


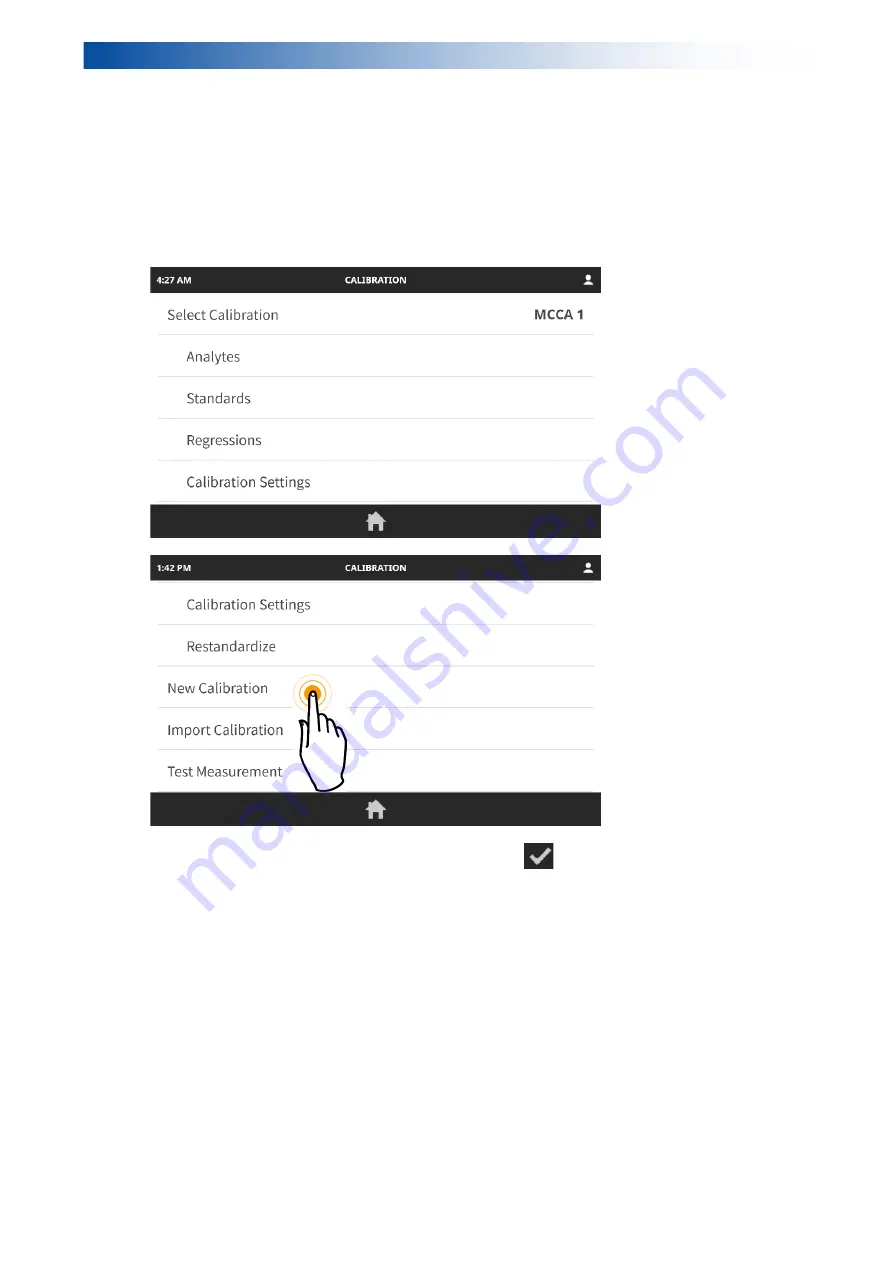
To create a new calibration: from the pull-down menu, select Method, then select New 

5.4.6.

Calibration. 


 Type in a name for the new calibration, then tap 

  to accept the data and return 

5.4.6.1.

to the Calibration menu. 


Summary of Contents for LAB-X5000

Page 1: ...User Guide Issue 7 0 EN 54 5103546 November 2018 LAB X5000 Benchtop XRF Analyzer ...

Page 2: ...is manual is copyrighted by Hitachi High Tech Analytical Science with all rights reserved No part of this manual may be reproduced transmitted or disclosed to a third party in any form or by any means without the express written permission of Hitachi High Tech Analytical Science 3 Hitachi High Tech Analytical Science assumes no liability for any direct indirect or consequential damages arising fro...

Page 3: ......

Page 4: ...ormance it is necessary to create an empirical calibration curve derived from standards with known values Please note that this manual provides general instructions on typical use of the instrument Operators should be properly trained in the use of the instrument Please consult with your local Hitachi High Tech Analytical Science representative to arrange for necessary training The contents of thi...

Page 5: ...onnectors 10 2 7 Secondary Safety Windows 10 2 8 Cleaning and maintaining the Instrument 11 3 USING THE LAB X5000 12 3 1 Powering Up the LAB X5000 12 3 2 User Access and PINs 13 3 3 How to Use the Software 13 3 4 Analyze a Sample 15 3 5 Analysis Results 19 4 PULL DOWN MENU AND QUICK OPTIONS 21 4 1 Accessing the Pull Down Menu 21 4 2 Quick Access Buttons 22 4 3 Wi Fi setup 22 4 4 Standard Deviation...

Page 6: ...7 TECHNICAL SPECIFICATION 48 7 1 LAB X5000 Series 48 7 2 X Ray Tube 48 8 APPENDICES 49 Appendix A Access for each PIN user level 49 Appendix B Sample Preparation 50 8 1 Solids 50 8 2 Powders and Minerals 50 8 3 Liquids 50 8 4 Organic Solids 50 8 5 Papers 50 8 6 Sample Cup Assembly 50 8 7 Filling Sample Cups 51 8 8 Testing for Sample Preparation Errors 51 Manufacturer 52 Customer Support 53 Hitachi...

Page 7: ...re In normal operation there is no radiation detectable above background level on any accessible surface On the LAB X5000 at 100mm from any surface the radiation dosage is at background 1 2 2 level EU requirement 1mS h 100mm It is the owner s responsibility to ensure that local radiation guidelines and 1 2 3 precautions are followed Radiation monitoring warning signs and other precautions may be n...

Page 8: ... Electromagnetic Compatibility The LAB X5000 unit contains high voltages It is not necessary to remove the cover 1 4 1 and the instrument should never be operated with its outer case removed Service work should only be carried out by Hitachi High Tech Analytical Science Qualified Service engineers The LAB X5000 has been designed in accordance with IEC61010 Safety requirements 1 4 2 for electrical ...

Page 9: ...ability of a sample for analysis refer to the material safety data sheet Exercise caution when handling and analyzing samples that give off flammable vapours This equipment is not designed to be used in explosive atmospheres 1 7 2 1 8 Disposal Contact the local Hitachi High Tech Analytical Science representative for assistance 1 8 1 WEEE Within the EU return the Lab X5000 to the local Hitachi High...

Page 10: ...ntegrated touch screen computer Software messages and results are shown on the touch screen computer with analytical results spectrum scans etc printed using the built in thermal printer Optional wireless Wi Fi capabilities allow for transmission and receipt of data The LAB X5000 is available in a range of models differing mainly in the application packages and options supplied Lab X5000 is intend...

Page 11: ...ws 3 51 3963527 USB with user manual and factory database backup 1 54 LX320 Safety window assembly tool 1 54 QX1009 Silica gel desiccant 601 057 1 54 LB3181 SUS transit warning label 1 XRFMS005 XRF SUS instructions 1 2 3 Mains Power Connections This instrument must be connected to a grounded mains supply If you are in any 2 3 1 doubt about your power supply consult a qualified electrician before p...

Page 12: ...1 of the instrument Any inquiries and correspondence relating to the instrument must include these numbers Start button Touch screen computer Sample port On board printer X Ray indicator Cancel button USB port for data export Power plug and rocker switch Hitachi High Tech Analytical Science 9 ...

Page 13: ...pplication It is very important that the correct film is used in the safety windows Incorrect film could invalidate the restandardization procedure The safety window must be kept clean and dry Do not touch the surface Dirt moisture oils or fingerprints may affect analysis results Secondary Window Assembly 2 7 3 Place the plastic outer ring on a flat surface Note If the ring has a stepped end 2 7 3...

Page 14: ...lace the assembled secondary safety window into the sample port on the top of 2 7 3 5 the analyzer 2 8 Cleaning and maintaining the Instrument Outer cover Use a damp not wet cloth Do not allow water to get inside instrument 2 8 1 Do not use solvents or pre moistened wipes Computer touch screen Use a dedicated screen wipe of microfiber or similar material 2 8 2 Lab X5000 has no periodic maintenance...

Page 15: ...m the main pull down menu It is a simple operation to restandardize an existing calibration 3 1 Powering Up the LAB X5000 A single rocker switch on the left side of the instrument powers the instrument and computer The 0 position is the OFF position no power and the l position is the ON position powered To power the instrument on insert the key into the round lock on the right side of the 3 1 1 in...

Page 16: ...ween user levels using the dropdown menu described below When gaining access at startup or when changing user levels from the pulldown menu 3 2 2 it is necessary to enter a PIN Code The PIN Code is different for each access level and may be changed by the Manager The standard Operator PIN is 0000 Advanced Operator and or Manager PINs are 3 2 3 provided at installation After the PIN Code has been e...

Page 17: ...p slide down long press flick left flick right Main screen The main screen is divided into three information zones 3 3 2 The black bar at the top of the screen contains static information relevant to the 3 3 2 1 current sample analysis The center section contains the most recent analysis results Flick right or left to 3 3 2 2 view previous results Indicates current operator level at top right corn...

Page 18: ...last measurement made Only works on most recent result will not delete older data Use to toggle between viewing numerical results and spectral results Settings menu not available in all screens Tap this icon to access more options 3 4 Analyze a Sample Elements analyzed Element concentrations units Precision data Pass fail indication Hitachi High Tech Analytical Science 15 ...

Page 19: ...on assumes that a calibration has already been established If not refer to sections 5 4 and 5 5 for details on creating a calibration Check that the Method is appropriate for the sample In the pull down menu select 3 4 1 Method Information ...

Page 20: ... return to the 3 4 1 2 Method menu Name the sample if Sample Naming is active in the pull down menu 3 4 2 Remove the glass cover from the sample port and insert a secondary safety window if 3 4 3 there is not one already installed For instructions on secondary safety window assembly see Section 2 6 3 5 Hitachi High Tech Analytical Science 17 ...

Page 21: ...button ring will light red This indicates that the X Ray tube is powered and the sample is being analyzed Press the Cancel button to stop the analysis at any time if necessary 3 4 6 1 Wait for the analysis to finish and the results to appear 3 4 7 Analysis progress will be displayed on the screen in a progress bar with time 3 4 7 1 remaining on the right Remove glass cover and insert secondary saf...

Page 22: ...screen will be displayed The name of the sample 3 5 1 is shown along with the chemistry of the results the measurement unit the error and the pass fail determination if one was programmed Swipe left or right to access previous results 3 5 2 Tapping the button will toggle to the spectral view of the results 3 5 3 Hitachi High Tech Analytical Science 19 ...

Page 23: ...ser Guide Tap to return to numerical results 3 5 4 To delete a result tap the trashcan icon in the bottom black bar 3 5 5 Note only the current result can be deleted Past results cannot be deleted in 3 5 5 1 this manner ...

Page 24: ...ain screen for navigating within the software 4 1 Accessing the Pull Down Menu To access the pull down menu drag the status bar down with finger 4 1 1 From there you can quickly toggle wi fi and other measurement settings on or off 4 1 2 access programs sample naming result history and settings Note that not all menus may be available depending on the user level of access 4 1 3 Hitachi High Tech A...

Page 25: ...n the results screen Sample Naming is used to name a sample prior to measurement Pass Fail is used to toggle between measurement pass fail information on the results screen Auto Printing is used to select if sample measurement results will automatically print from the on board printer Note that it is possible to print results from any previous result Font Size is used to toggle between results dis...

Page 26: ...ears next to the network name you will be asked to type it in When Wi Fi is on and connected you ll see the symbol in the status bar 4 3 4 To prevent the instrument from automatically connecting to a network tap the 4 3 5 network s menu and select Forget network To see details of a network you re currently connected to tap its name A status popup 4 3 6 will open and display the Mac address IP addr...

Page 27: ...se whether to display pass fail data in the 4 5 1 analytical results screen Limits for Pass and Fail are set in the Calibration Settings for each element 4 5 2 4 6 Auto Printing Auto Printing 4 6 1 The Auto Printing setting is a persistent setting meaning that once it is engaged it 4 6 2 remains engaged until turned off When the Auto Printing icon is selected it will remain orange instead of grey ...

Page 28: ...ment Open pull down menu 4 7 1 1 Tap Sample Naming 4 7 1 2 When the Sample Naming icon is selected it will remain orange instead of grey 4 7 2 When the Start button is pressed the screen will change to allow you to name the 4 7 2 1 sample prior to analysis Once the done button is tapped the X rays will turn on and the analysis will begin 4 7 2 2 4 8 Font Size Hitachi High Tech Analytical Science 2...

Page 29: ...ll down menu 4 8 1 Only the first three rows of the results will display on the screen in a larger font 4 8 2 This is a persistent setting once chosen the icon will remain orange and the results 4 8 3 will display as shown above until the icon is tapped again turning off the large font display ...

Page 30: ...enu is the Options Menu This is the main navigation panel for the software Each choice in the menu leads to submenus where more settings and choices are available 5 1 Accessing the Options Menu Slide a finger from top to bottom of the screen to access the pulldown menu All 5 1 1 Options are visible on the right hand side of the pulldown menu Method is used to choose the parameters for the analysis...

Page 31: ...al changes Only active when blank subtraction is applied to the calibration 5 2 Method Selecting Method displays all Method options available at the current user level Note 5 2 1 that not all options are available at all user levels Standards calibration settings and regressions are discussed in subsequent 5 2 2 sections Select Calibration Choose from calibrations currently in the instrument modif...

Page 32: ...was built on another LAB X unit Test Measurement 5 3 Restandardize Restandardization involves measuring the Setting Up Samples SUSs that were 5 3 1 measured as part of the calibration Once they have been measured they correct for any change in the position of the calibration line both in terms of background or sensitivity change If the calibration involved a matrix correction such as an overlap co...

Page 33: ...ditions then measuring the standards and performing regression calculations which may involve instrument or matrix corrections Once a calibration has been established it can be saved for future recall and analysis 5 4 5 or can be exported to another LAB X instrument To create a new calibration from the pull down menu select Method then select New 5 4 6 Calibration Type in a name for the new calibr...

Page 34: ... analyte 5 4 6 2 Tap one analyte to select then tap to accept the data and return to the 5 4 6 3 Calibration menu For each element determine the settings for the following parameters 5 4 6 4 Hitachi High Tech Analytical Science 31 ...

Page 35: ...calculated values off Display Name Default is 2 letter element abbreviation Display Unit Default is Number of Decimals Select appropriate significant figures The default setting is 2 Show Negative Values Toggle on off to show on or hide off negative values When set to off and calculated results are negative the display will show 0 Default setting is off Pass Fail Limits Toggle to turn on Once on u...

Page 36: ... 8 standard can be used for configuring instrument corrections but the standard will not be used to calculate the regression Tap an element Type in the concentration of the element in the standard in the 5 4 6 9 defined unit An individual analyte from a standard can be omitted from the regression by tapping the box by Active to remove the checkmark Hitachi High Tech Analytical Science 33 ...

Page 37: ... selected regression model a warning will 5 4 7 1 appear More standards are needed for selected regression model 5 5 Regressions Select Method from the pull down menu then choose Regressions to perform a 5 5 1 regression of the raw intensity data against the given concentration of the standards The error analysis for all elements in the analyzed standards will be calculated The minimum number of s...

Page 38: ... pre programmed calibration and save it as a new calibration name then measure an appropriate set of standards and SUSs Importing a calibration from another LAB X instrument 5 6 2 5 7 Test Measurement Test Measurement allows for a full spectrum scan of a sample after which the resulting 5 7 1 spectrum scan can be investigated i e element peaks identified view is zoomed in or out saved to USB or a ...

Page 39: ...available multiple 5 7 3 1 elements can be selected Tap to accept input and return to Test Measurement menu Analysis time Any time can be specified up to a maximum of 999 seconds Type 5 7 3 2 in desired analysis time then tap to accept the input and return to Test Measurement menu ...

Page 40: ...ap to accept the input and return the Test Measurement menu Filter For those systems with filters choose which if any filter should be used 5 7 3 5 Select a filter from the list of 5 possible filters then tap to accept the input and return to the Test Measurement menu There are three filter options on the LAB X5000 depending on options chosen and which X ray tube is installed 1 No filters 2 Ti 0 O...

Page 41: ...d Conditions Once all parameters have been set press the Start button to begin the Test 5 7 4 Measurement After the sample has been measured the Test Measurement displays intensity in count 5 7 5 on the vertical scale and energy level in eV on the horizontal scale In some cases the L or M X ray lines of high atomic number elements such as Pb 5 7 6 could be the peak displayed on the spectrum It is ...

Page 42: ... board computer memory 5 8 1 Thousands of results are saved before the oldest results are overwritten by new results It is good practice to backup and export analysis results on a regular basis Select Results from the pull down menu 5 8 2 All past sample results will be available as a list Use the and to toggle 5 8 3 between sorting in a chronological list or in alphabetical order by sample name S...

Page 43: ...at week The number of samples in the batch is indicated in parentheses after the date Selecting a name batch will select all samples analyzed with that name Tap the 5 8 1 2 to view all samples analyzed with that name The number of samples in the batch is indicated in parentheses after the name To export selected results insert a USB stick in the USB port on the right side of the 5 8 2 instrument t...

Page 44: ...ark will show 5 8 1 for selected samples Then tap in the bottom black bar A warning box will appear to confirm deletion Tap to confirm deletion 5 8 1 1 Deletion is not reversible 5 8 1 2 5 9 Settings Date samples were analyzed Number of samples in group Tap to export checked results Tap box to un select group Tap to show individual results Hitachi High Tech Analytical Science 41 ...

Page 45: ...s menu contains the options for configuring updating and connecting your instrument Not all options are available at all user levels Screen Timeout Determine the idle time before the screen goes dark Wi Fi settings Connect to a Wi Fi network ...

Page 46: ... available to Service Update Software Only available to Manager and Service requires USB stick with upgrade software Feature Licenses Only available to Service Software Licenses Only available to Service Regulatory Shows which international and national standards are met by the hardware and software Does not reference state or local registration or licensing Backup Create restore backups to USB or...

Page 47: ...sity of the blank A reference blank sample must be measured in the instrument correction section of the regression To apply a new blank correction to the regression In the pull down menu select 6 1 1 1 Method then tap Regressions Choose Blank Correction A screen to name the blank sample will display Type in a name for the blank 6 1 1 2 sample Insert the sample into the sample port and press the St...

Page 48: ...or and apply this during the Regression The overlap correction can be applied on more than one element 6 2 2 2 To use Overlap Corrections from the pull down menu select Method then tap 6 2 3 Regressions Choose Overlap Corrections Toggle to enable Tap to add a correction 6 2 4 6 3 Ratio Correction This option is used when two element segments need to be ratioed 6 3 1 A primary use of this technique...

Page 49: ...mple when an element has been fluoresced by incident radiation from the X ray 6 4 2 tube the element emits secondary or characteristic X rays Each element requires a certain minimum energy to excite it and this is called the absorption edge Ca value 4 04keV If a primary X ray has an energy of 4keV then the calcium will 6 4 2 1 not be excited because the incoming radiation is not energetic enough b...

Page 50: ...ect for the effect 6 4 2 3 Select Method from the pull down menu then tap Regressions Choose 6 4 3 Absorption Enhancement Corrections 6 5 Setting Up Samples SUSs for Instrument Corrections When an X ray correction is to be applied such as blank or overlap correction then a 6 5 1 sample or Setting Up Sample SUS must be measured before a Regression is performed If a Blank Subtraction has been specif...

Page 51: ...operating altitude 2000 m 6500 ft Embedded storage NAND 4 GB Flash Memory Available storage space 2 3 GB Maximum measurement count 100 000 Dimensions W x L x H 440 mm x 520 mm x 155 mm Weight 20 kg Pollution Degree PD2 Ingress Protection degree Not classified Overvoltage category II 7 2 X Ray Tube Target material Palladium Pd or Titanium Ti Window thickness 0 005 in Anode voltage range 4 kV to 30 ...

Page 52: ...tup A11 x Pull down menu Toggle Std display x x Pull down menu Toggle Pass fail display x x Pull down menu Toggle Wi fi x x Pull down menu Toggle Std sample naming x x Pull down menu Toggle auto printing x x Pull down menu Toggle font size x x x QC check sample x x Software update x Select method x x x View stored results x x x Delete last result x x x Test measurement x x x Backup x Restore x Hit...

Page 53: ...hould be eliminated or reduced as well as is possible 8 2 Powders and Minerals Most powders can be analyzed by simply pouring the powder into a sample cup 8 2 1 The sample cup should be lightly tapped on a clean bench to settle the contents after 8 2 2 pouring Non homogenous samples low density fluffy samples or powders with larger 8 2 3 particles must be ground and compacted into a pellet Pellets...

Page 54: ...asure elements below calcium in the periodic table a minimum sample depth of 8 7 1 2 3mm is sufficient For heavier elements fill the cups to the line in the interior of the sample cup to ensure 8 7 2 a constant volume 8 8 Testing for Sample Preparation Errors To test for instrument precision place a sample of material into the instrument and 8 8 1 analyze it ten times in a row without removing it ...

Page 55: ...mple cup and analyze again An increase in the signal implies that the original sample was not thick enough for the X ray penetration depth and samples must be made thicker or of constant thickness Hitachi High Tech Analytical Science Customer Support Manufacturer ...

Page 56: ...Customer Support Hitachi High Tech Analytical Science 53 ...

Reviews: