4.3 Drawing Methods
4-46
Trend Graph Scale
Drawing method
1.
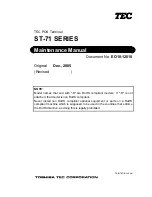
Select a line color from the [Pen Color] icon on the toolbar.
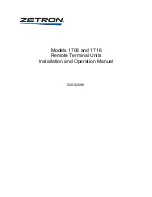
1.
Click the “
” mark on the right of the [Scale] icon on the toolbar.
Select [Trend Graph Scale] from the scale type displayed.
The icon is depressed and the mouse cursor is turned into a cross-shaped cursor.
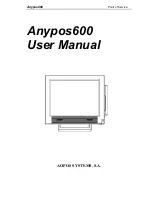
2.
Drag the mouse from the start point to the end point in the same way as drawing a rectangle. The
trend graph scale is drawn.
3.
To reset the drawing setting, right-click or double-click the mouse button. By dragging the mouse
again without resetting it, you can draw another scale continuously.
Start point
End point
End point
Start point
Drag.
Drag.
Summary of Contents for V8 series
Page 1: ...V8series Operation Manual...
Page 2: ......
Page 4: ......
Page 12: ......
Page 16: ......
Page 30: ......
Page 45: ...1 3 Starting 1 15 1 Introduction 5 The selected screen data file is opened...
Page 50: ...1 4 Quitting 1 20 Please use this page freely...
Page 92: ...2 6 Screen Composition 2 42 Please use this page freely...
Page 263: ...4 4 Graphic Properties Setting 4 59 4 Drawing Example of Item Dialog Line Box Text...
Page 264: ...4 4 Graphic Properties Setting 4 60 Please use this page freely...
Page 348: ...5 18 Multi language 5 84 Please use this page freely...
Page 406: ...6 7 After Transfer Communication with PLC 6 58 Please use this page freely...
Page 413: ...7 1 Overview 7 7 7 Print Print Example Screen Output List Output...
Page 414: ...7 1 Overview 7 8 Table Print Screens Graphic library...
Page 415: ...7 1 Overview 7 9 7 Print System Setting Memory Use List...
Page 416: ...7 1 Overview 7 10 Use Cross reference Message For the graphic library...
Page 417: ...7 1 Overview 7 11 7 Print Animation...
Page 418: ...7 1 Overview 7 12 Please use this page freely...
Page 610: ...After Completion of Parts Editing A3 30 Please use this page freely...