


File
menu. A dialog box appears, with a space to fill in with an eight-letter name (the program
automatically attaches a
.txt
suffix to these files). If you have saved previous files, a grayed-out list of
these names appears as well. Typical to Windows programs,
Directories
and
Drives
boxes can be
used to locate other storage devices on which to save your data.
5.4.5 Printing values
To place this list of measurements into a tabular format and send it to the Windows printer, choose
the
command from the
File
menu. The program asks you to enter
Title
and
Author
information. Note that the
Date
is fixed by your operating system. The resulting printed list will
include this information on each page.
5.4.6 Clearing stored values
To clear all the values stored in the analyzer via the Hach 3654 program, choose the
Clear Data
command from the
Logger
menu. Since this action will clear the storage memory of the instrument, a
warning appears first. Choose
OK
to bring up the next dialog box to confirm the clear action. Choose
Clear
to start the memory clear operation. A message,
Reset should be completed
appears in this
box when the task is finished.
Note: You can accomplish the same thing passively, by simply allowing the analyzer to overwrite a set of stored
values with new ones.
5.5 Monitoring measurements in real-time
You may wish to analyze a particular sampling point via the Hach 3654 program's
Monitoring
menu.
To use this Monitoring chart, the instrument must be connected to your PC. Choose
Monitoring
from
the Hach 3654 menu to bring up a chart display.
The Monitoring chart shows the gas concentration (in blue), temperature (in red), and pressure (in
green) as the sample is being measured by the instrument. The chart is updated directly from
instrument measurements, at a rate determined by the time scale set in the
TIMEBASE
box at the
lower right corner of the chart.
Click the
TIMEBASE
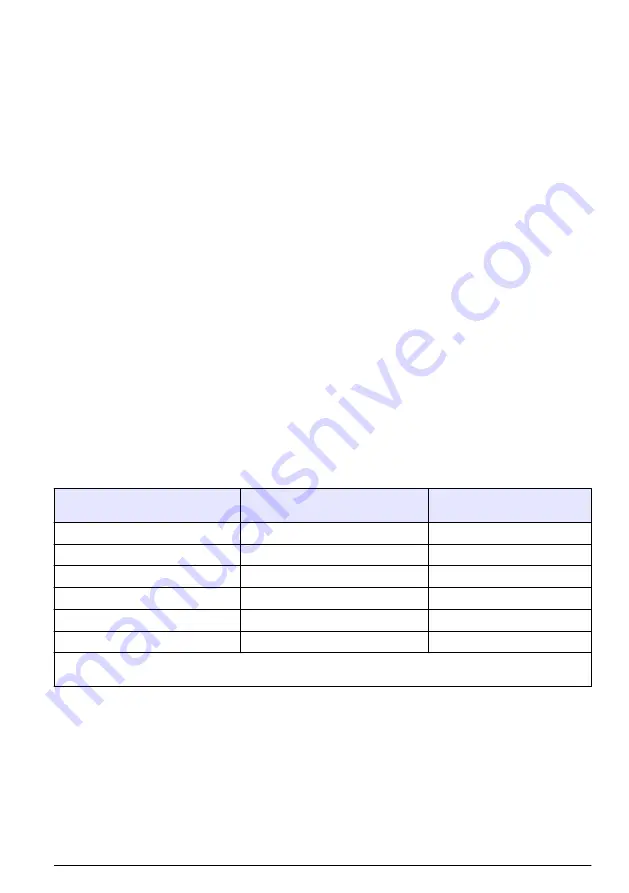
up/down pointers to change the time scale of the divisions of the chart. Each
division mark along the baseline (1, 2, ...10) can be made to represent from 30 seconds to 2½ hours,
providing from 5 minutes to 25 hours of continuously displayed samples. The chart updating rate is
determined by the time scale selected.
Timebase
Updating rate*
Maximum samples
(10 divisions)
30 Seconds/Division
5 Seconds/Sample
60
1 Minute/Division
5 Seconds/Sample
120
10 Minutes/Division
5 Seconds/Sample
1,200
30 Minutes/Division
9 Seconds/Sample
2,000
1 Hour/Division
18 Seconds/Sample
2,000
2.5 Hours/Division
45 Seconds/Sample
2,000
*This chart's updating rate is independent from the acquisition rate. Refer to
Automatic data acquisition - Setting
Click on the
Continuous
box, in the lower right corner, to enable or disable continuous charting.
When this box is checked, the chart scrolls continuously after reaching the
10
division, and the oldest
samples are lost off the left of the chart. When
Continuous
is not checked, the chart stops displaying
new results after reaching the
10
division, and all subsequent measurements are lost.
Click the up/down pointers for each measurement variable (
GAS
,
TEMPERATURE
and
PRESSURE
) at the right of the chart to change the scaling of that value on the chart. The display of
each measurement variable may be turned on or off by choosing the appropriate
On
or
Off
switch at
the right of the chart.
If your measurements do not chart properly, try using a higher or lower value scale or time base than
the one displayed. Adjust these scale factors
before
starting the monitoring operation. A running
English
17


