21
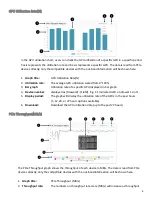
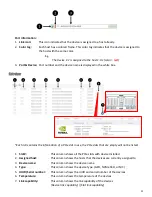
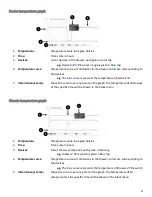
Device temperature graph
1.
Temperature:
Temperature scale in degree Celsius
2.
Time:
Time scale in hours
3.
Devices:
List of devices in the drawer, each given a color tag
e.g.
Device
1:2
in the above image is given a
blue
tag
4.
Temperature curve:
Temperature curves of all devices in the drawer, colors are corresponding to
the devices
e.g.
The
blue
curve represents the temperature of device
1:2
5.
Instantaneous temp.:
Move the cursor over any point on the graph, the temperature of all devices
at the specific time will be shown in the black menu
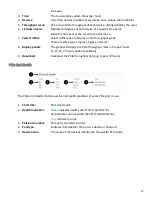
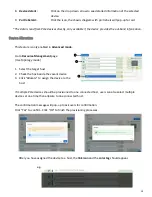
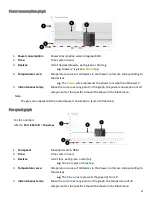
Chassis temperature graph
1.
Temperature:
Temperature scale in degree Celsius
2.
Time:
Time scale in hours
3.
Devices:
List of chassis component, each given a color tag
e.g.
Drawer 2 PCIe switch is given a
blue
tag
4.
Temperature curve:
Temperature curves of all devices in the drawer, colors are corresponding to
the devices
e.g.
The
blue
curve represents the temperature of Drawer 2 PCIe switch
5.
Instantaneous temp.:
Move the cursor over any point on the graph, the temperature of all
components at the specific time will be shown in the black menu
Summary of Contents for Falcon 4010
Page 1: ...Falcon 4010 User Manual ...

