9
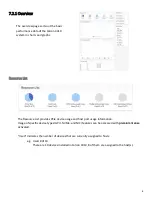
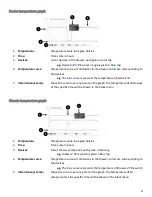
GPU Utilization Rate(%)
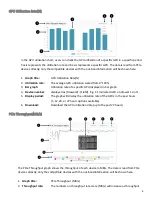
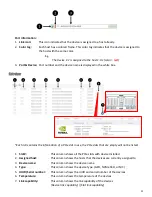
In the GPU utilization chart, users can check the GPU utilization of a specific GPU in a specific period.
Y-axis represents the utilization rate and X-axis represents a specific GPU. The data is read from PCIe
devices directly, only the compatible devices with the out-band information will be shown here.
1.
Graph title:
GPU Utilization Rate(%)
2.
Utilization rate:
The average GPU utilization scaled from 0~100%
3.
Bar graph:
Utilization rate of a specific GPU displayed in bar graph
4.
Device number:
displayed as [Drawer#] : [Slot#]. E.g. 1:1 indicated GPU on drawer 1 slot 1.
5.
Display period:
The graph will display the utilization rate of the GPUs in the past hours.
(1, 12, 24, or 72 hours options available)
6.
Download:
Download the GPU utilization data (up to the past 72 hours)
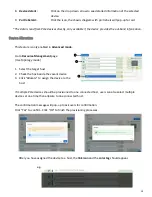
PCIe Throughput(MB/s)
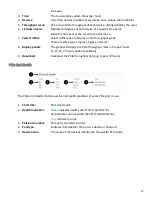
The PCIe Throughput graph shows the throughput of each device in MB/s. The data is read from PCIe
devices directly, only the compatible devices with the out-band information will be shown here.
1.
Graph title:
PCIe Throughput (MB/s)
2.
Throughput rate:
The numbers on throughput rate scale (MB/s) will increase as throughput
Summary of Contents for Falcon 4010
Page 1: ...Falcon 4010 User Manual ...


