25
In each submenu, options are navigated by either clicking with the touch pen or moving the joystick left or right. The
highlighted option is confirmed by clicking with the pen or pressing the joystick.
To exit the menu system
and
return to a live thermal image, press button C or click the icon “Menu” at the right top
corner of the screen.
“File” submenu
Move joystick up and down or use touch screen to select “File” submenu.
“File” submenu has two options, “File list” and “Analysis tool”. Select each option by moving joystick left and right or
using touch screen.
“File list”
“File list”: please see above chapter on image & video playback
“
Analysis Tool”
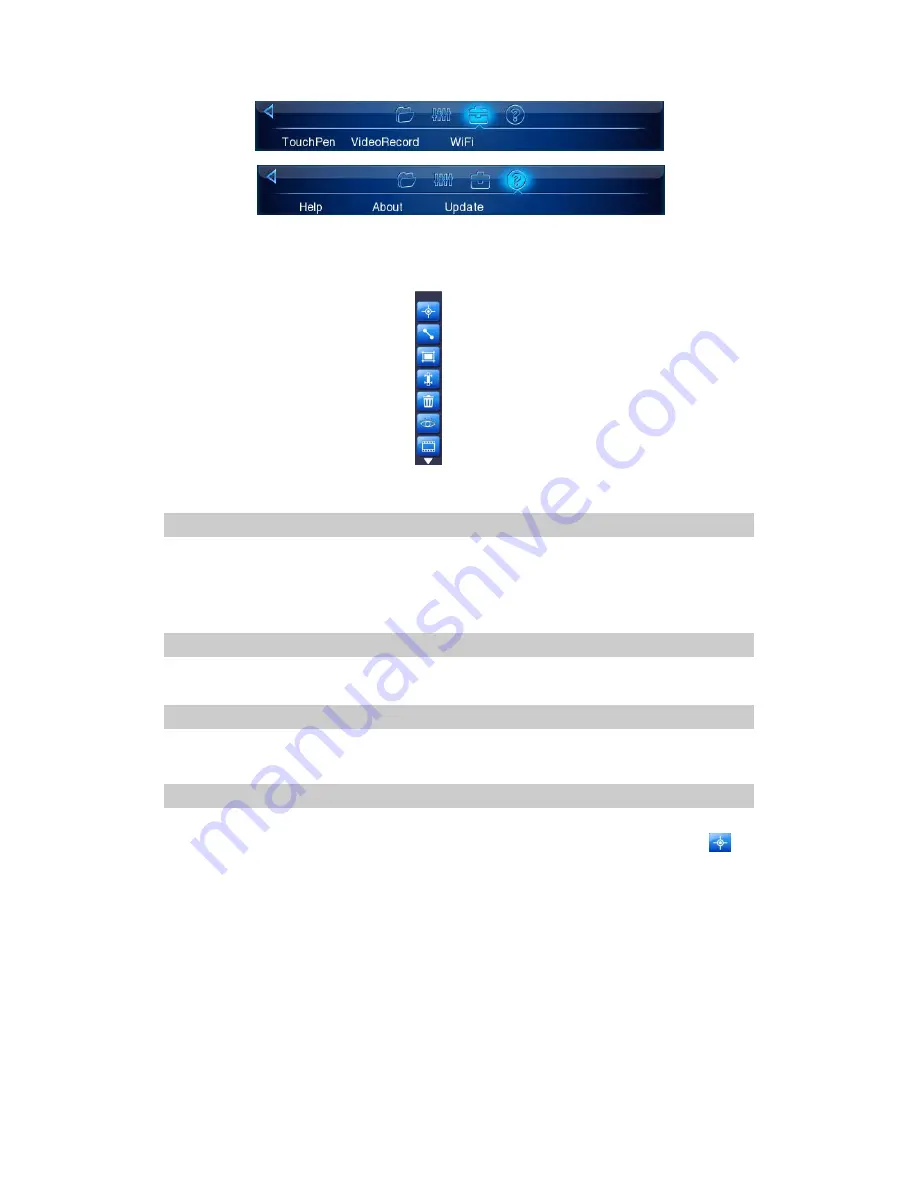
Select “Analysis tool”, and press the
joystick
or click it with touch pen, the toolbar will appear as below.
“Spot Analysis”
Spot Analysis can be performed on live or zoomed or frozen or saved images.
In real-time image, bring up the
main
menu, select “Analysis tool” under submenu “File”, and then select spot
to
do spot analysis.
In frozen images, bring up the frozen toolbar with the touch screen or joystick. Click the icon spot analysis to do spot
analysis.
In saved images, spot
analysis
can be done when the images are replayed. Bring up the replay toolbar and select spot
analysis to do spot analysis.
One spot can be added by clicking icon spot analysis; total 8 spots can be showed in screen.
Each point
temperature
value is displayed in the side of the point, use the touch pen to switch between various points,
the temperature value of selected point is shown in red.
To move the
selected
point, use the touch pen to drag the point to the desired position and release, the temperature of


