


Hexylon High-performance portable meter
60
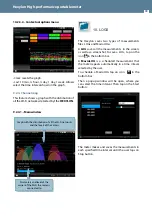
10.2.3.2.- Contextual options menu
• Clear: resets the graph.
• Last: 10 min, ½ hour, ½ day, 1 day, 1 week. Allows
select the time interval shown in the graph.
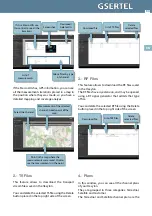
9.2.4- Channel map
This feature shows a graph with the distribution of
all the Wi-Fi networks detected byt the
HEXYLON
.
9.2.4.1.- Main window
Parameters and level of the
carrier of the Wi-Fi the meter is
connected to
Graph with the distribution of all the Wi-Fi networks
and the levels of the carriers
10. LOGS
The Hexylon saves two types of measurements
files: LOGs and MacroLOGs.
A
LOG
saves all the measurements in the screen,
as well as a screenshot. To save a LOG, tap on the
icon in the bottom bar.
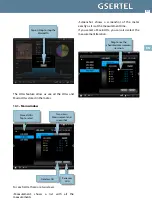
A
MacroLOG
is a scheduled measurement that
the meter repeats automatically in a time inteval
selected by the user.
To schedule a MacroLOG tap on icon in the
bottom bar.
Then a popup window will be open, where you
can select the time interval. Then tap on the Start
button:
The meter makes and saves the measurements in
each specified time interval until the user taps on
Stop button.
Summary of Contents for Hexylon
Page 2: ......
Page 69: ...EN 69...
Page 70: ...Hexylon High performance portable meter 70...
Page 72: ......
Page 73: ...901620_901621_1 23_EN...