


Figure 5-2
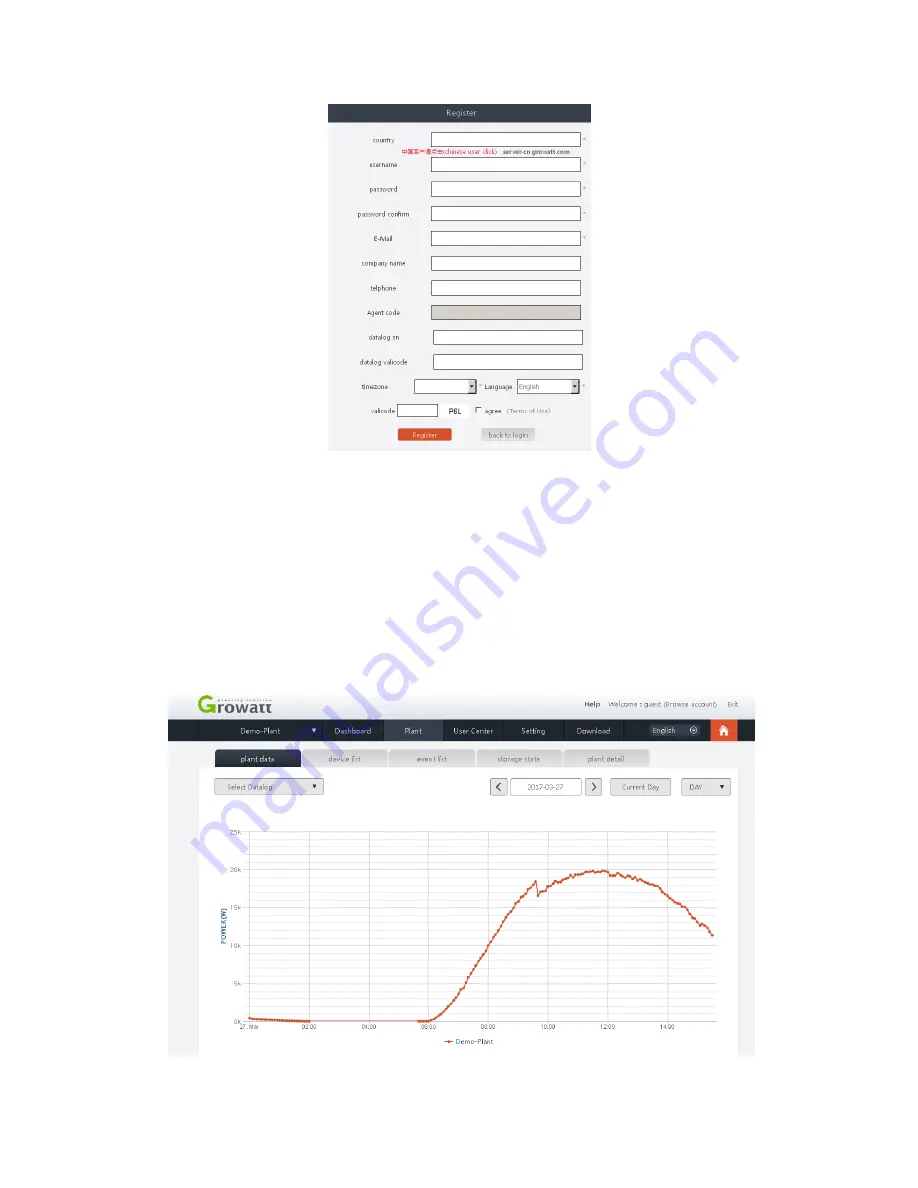
5.2 View the Monitoring Data
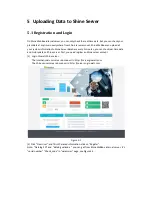
(1) After register, it will automatically jump to the Shine Server main interface. Click on the
"power plant" → "plant data", as shown in Figure 5-3, the information displayed for the daily
power chart of the plant. In drop-down list "select Datalog", you can choose to see inverter data
and chart.
Figure 5-3


