Owner’s Manual for Power Zone Connectivity Server
15
Installation and Operation
Screen Icon Details
Home Screen
This screen displays bar graphs for the most common
measurements, and an overall health check for the
generator. The number of displayed measurements will
change depending on whether or not the generator is
running.
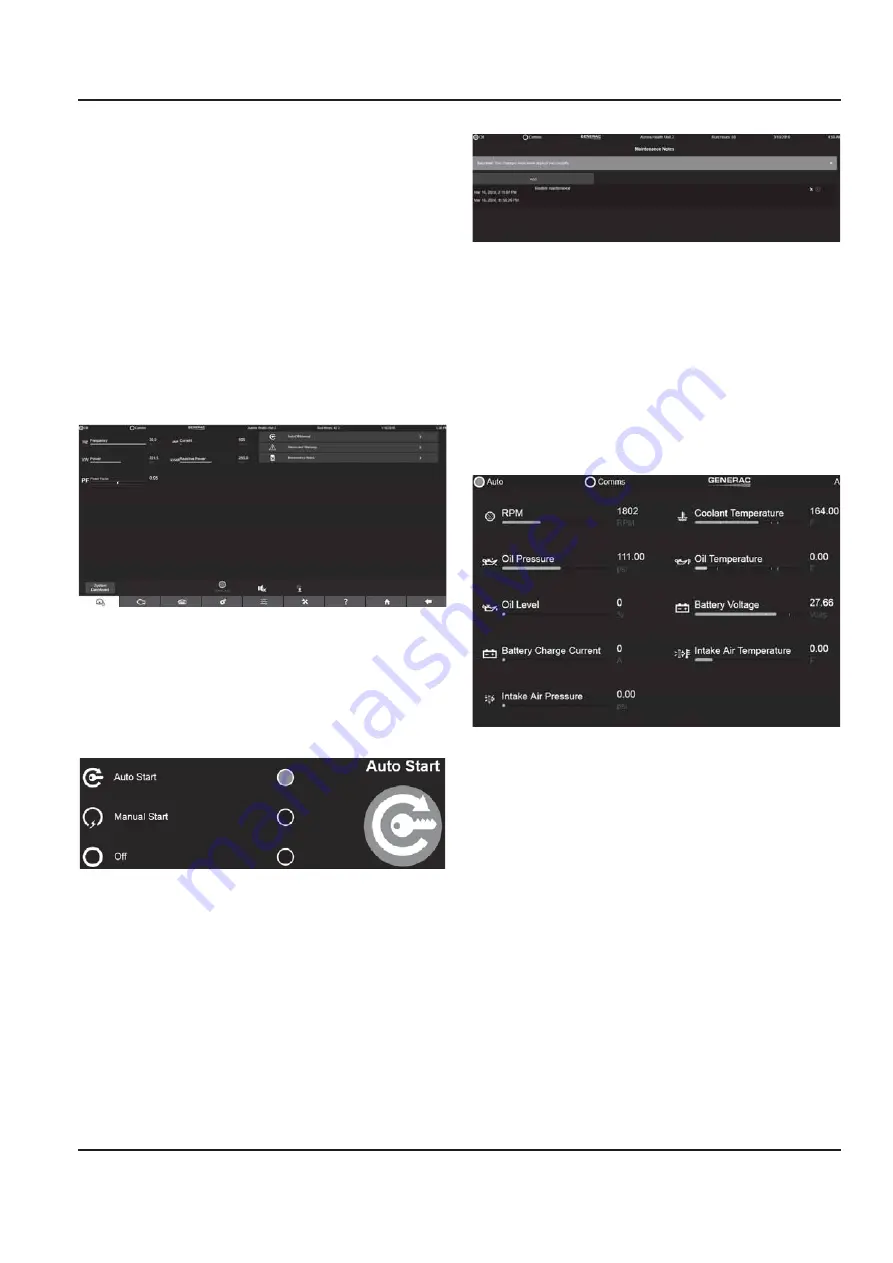
System Dashboard Screen
See
Figure 3-21
. This screen displays bargraphs for the
most common measurements. Some values, such as
frequency, will display in red when the unit is not running.
Figure 3-21. System Dashboard
AUTO/OFF/MANUAL
See
Figure 3-22
. This screen displays the status of the
keyswitch (if equipped). The generator can be remotely
started and stopped from this screen.
Figure 3-22. ON/OFF Status
Maintenance Notes
See
Figure 3-23
. This screen displays an editable file of
maintenance notes. Click on the “Add” button to add
notes and click the “Submit” button. The notes will appear
below. "Routine Maintenance" has been added as shown
in
Figure 3-23
. The notes can be edited or deleted by
choosing the edit or delete small icons on the notes.
Figure 3-23. Maintenance Notes
Engine Detail Screen
See
Figure 3-24
. The Engine Detail Screen displays
bargraphs of measured engine parameters. In some
cases the readings will be empty if the associated
sensors are not fitted. The engine screen also provides a
button to access the Engine Settings screen. This screen
allows editing of engine related configuration parameters.
Figure 3-24. Engine Screen
Engine Settings
See
Figure 3-25
. The Engine Settings screen displays
an icon for each entry on the left side of the entry. Click
on the text field and enter a new value. The new value is
entered and saved. If the value is out of range a red
warning will display and prevent saving of data. The
range will be displayed above the keyboard entry as
shown in
Figure 3-19
.
007530
007531
007532
007631


