


SXBlue GPS Reference Manual
9
A DOS-based RINEX translator is available; however, RINEX has no facility to store station
information. Please contact Geneq if you wish to use this utility.
2.6 Evaluating SXBlue GPS Performance
The SXBlue GPS receiver performance has been evaluated with the objective of
determining best-case performance in a real-world environment. Static testing has shown
that the SXBlue GPS achieves a performance better than one meter 95% of the time.
The qualifier of 95% is a statistical probability. Often you may see manufacturers using a
probability of ‘rms’ or standard deviation. Performance measures with these probabilities
are not directly comparable to a 95% measure since they are a lower probability (less than
70% probability). This means that less often, a product would position within a radius of the
prescribed amount.
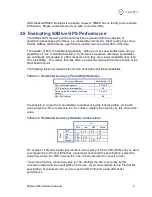
The following table summarizes the common horizontal statistical probabilities.
Table 2-1 Horizontal Accuracy Probability Statistics
Accuracy Measure
Probability (%)
Rms (root mean square)
63 to 68
CEP (circular error probability)
50
2drms (twice the distance root mean
square)
95 to 98
R95 (95% radius)
95
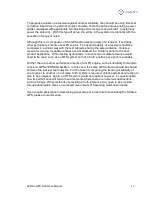
It is possible to convert from one statistic to another using the following table. Using the
value where the ‘From’ row meets the ‘To’ column, multiply the accuracy by this conversion
value.
Table 2-2 Horizontal Accuracy Statistic Conversions
To
CEP
rms
R95
2drms
CEP
1
1.2
2.1
2.4
rms
0.83
1
1.7
2.0
R95
0.48
0.59
1
1.2
F
ro
m
2drms
0.42
0.5
0.83
1
For example, if Product A after test results in an accuracy of 90 cm 95% (R95) and you want
to compare this to Product B that has a sub-meter horizontal rms specification, select the
value from where the ‘R95’ row and the ‘rms’ column intersect (to convert to rms).
You will see that this conversion value is 0.59. Multiply the 90 cm accuracy by this
conversion factor and the result will be 53 cm rms. If you now compare this to Product B’s
specification of sub-meter rms, you can see the first Product A would offer better
performance.