


13
7.4 Display properties
There are four parameters that determine how a channel value is displayed on the dash as follows:
•
Decimal places
– For example, temperature channels are usually displayed as whole numbers (0
decimal places), but exhaust lambda will usually be shown to 2 decimal places.
•
Default colour
– Applies only to dial gauges (page styles 3-9). The colour of the text values (page
style 1) are setup on the general settings tab, as is the label colour.
•
Colour conditions
– Applies only to dial gauges, gear number and RPM bar. Allows the colour of
the gauge to change depending on the channel value (or RPM in the case of the gear number).
•
Hysteresis
– specifies the minimum change in channel value before the dash is updated. This is
used to ‘dampen’ the display when values are rapidly changing, such as engine RPM.
7.5 Display colours
One of the significant features of the Geartronics G-Dash is its ability to change the colour of the channel
gauges based on the value of that channel. For example, you might want the coolant temperature gauge to
start off blue at low temperature, turning green when it’s in the normal range, then finally red if the
temperature gets too high. By changing colour in this way, the driver does not need to read the actual
value, but a quick glance at the display will confirm that everything is good if all the gauges are green. To
set up colour conditions, look under the
Display
heading in the channel properties window and click the
words “Colour Conditions”. A small box containing 3 dots will appear at the right hand side. Click the box
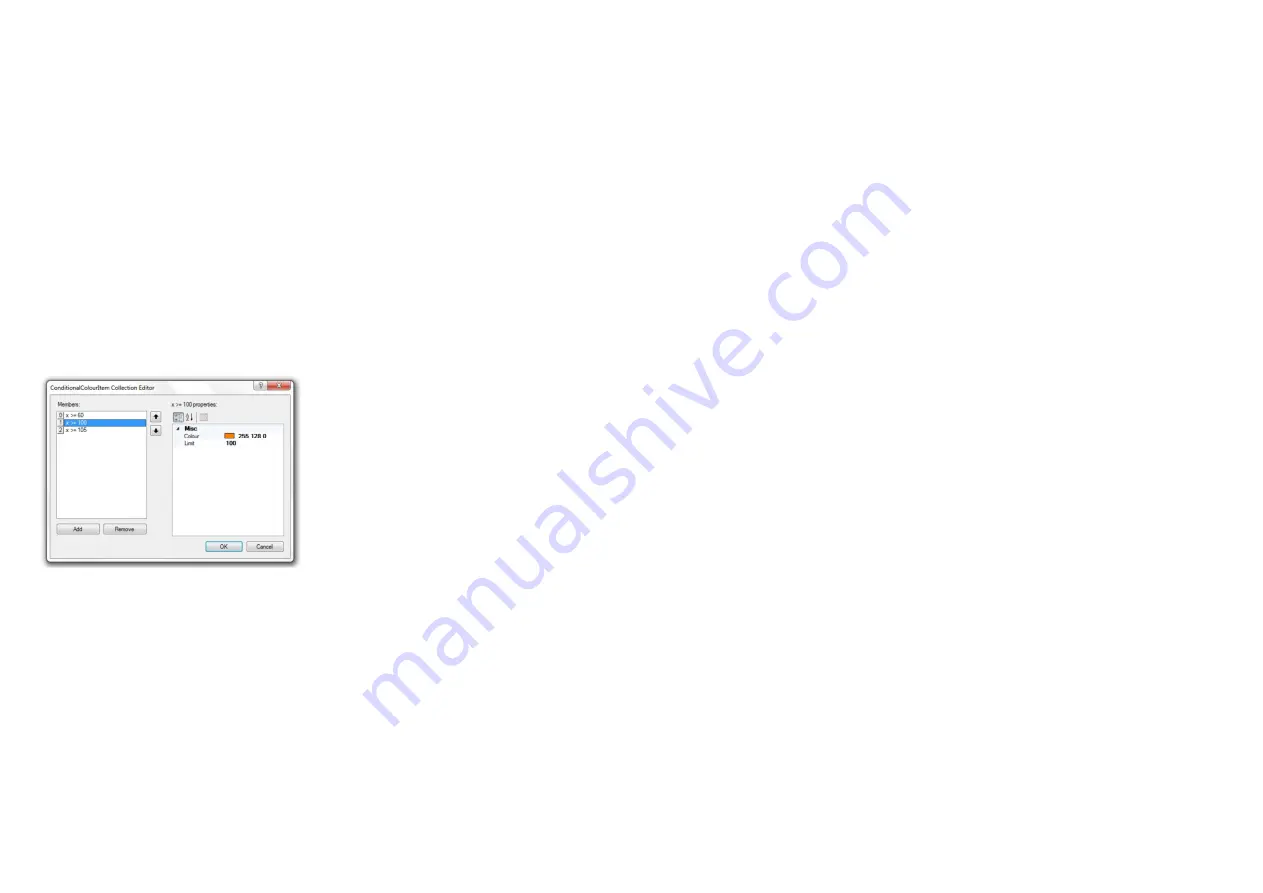
and the conditional colour editor window will open. Shown below is an example from a temperature gauge
setup:
In the above example, the gauge default colour was set to blue, which would change to green as the
temperature increased to 60°, then orange at 100°, and finally red at 105°.
Colour changes can only be applied to gauges (page styles 3-9), the RPM bar and the gear number. In the
case of the gear number the colour change is based on the engine RPM. In this way, the gear number can
be used as a form of shift light.
Note: A maximum of 15 colour changes may be assigned to any one channel. However, only 40 colour
changes are permitted in total across all channels.
14
7.6 Display limits
Regardless of the actual value of the received data, you must set upper and lower limits to the values that
are displayed on the dash. This can be useful when setting up temperature and pressure dial displays
when the user wishes to show the normal value as half way around the gauge. For example, the normal
engine coolant temperature may be 80°C but the ECU might transmit values between -20 and +200.
Therefore we can set the display limits between 40 and 120 so that the normal value of 80 is mid-way
around the gauge. It is also a way of increasing the resolution of the segmented gauge around the ‘normal’
value.
7.7 CAN data scaling
Most engine ECUs transmit raw data as a multiple of the actual channel value, additionally a positive or
negative offset may be applied. For example, the ECU may transmit the throttle position as 10x the actual
value, so 0-100% is transmitted as a raw value as 0-1000. In this instance the Divisor must be set to 10 in
order to scale back to 0-100%. Another example may be a temperature value transmitted with a negative
offset of 40 so that it becomes easier to transmit and display temperatures below 0°C. The G-Dash
software allows the user to apply multipliers and divisors (in any combination) as well as offsets that may
be applied either before or after any divisor or multiplier. Multiplier and divisor values may be integer values
or floating point. The result of the scaling = ((raw value +/- pre offset) x multiplier /divisor) +/- post offset
7.8 Configuring analogue input channels
In addition to receiving data on the CAN bus, the dashboard has 5 analogue inputs (ADC1-5) that may be
connected to any 3-wire 0-5v, or 2-wire resistive sensor. When using resistive sensors (such as
temperature sensors) it will be necessary to connect an appropriate pull-up resistor between 5v and the
input pin. Your sensor supplier should be able to advise a suitable value for the pull-up, although it’s typical
to use values between 1Kohm and 2Kohm.
The analogue inputs may also be configured as digital inputs to measure wheel speed sensors or tacho
signals etc. Inputs 1-4 may also be used to measure pulse frequency, pulse intervals or pulse counts.
Additionally, ADC3, 4 & 5 may be assigned to the page and alarm button functions when it’s not convenient
to operate the buttons on the front facia of the dash.
When using an analogue gear position sensor, this must be connected to the ADC1 input on pin 3 (named
“Gear Position”).
7.9 Analogue scaling
When using analogue sensors it’s essential to set an appropriate scaling so that the input voltage translates
to the actual channel value. This may be a simple linear relationship where, for example, an input voltage
between 0v and 5v translates to a pressure of between 0 and 10bar. However, 2-wire resistive temperature
sensors generally have a non-linear scaling. The example on the following page shows the scaling for a
Bosch temperature sensor commonly used for oil and water temperature measurement.


