136 EcoLab
–
Special Tools
Special Tools
Predicting
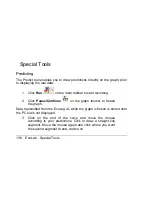
The Predict tool enables you to draw predictions directly on the graph, prior
to displaying the real data:
1. Click
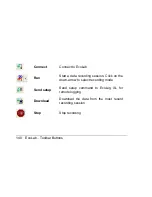
Run
on the main toolbar to start recording.
2. Click
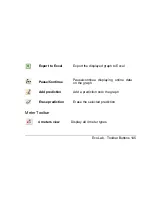
Pause/Continue
on the graph toolbar to freeze
the graph.
Data transmitted from the EcoLog XL while the graph is frozen is stored onto
the PC but is not displayed.
3. Click on the end of the curve and move the mouse
according to your predictions. Click to draw a straight-line
segment. Move the mouse again and click where you want
the second segment to end, and so on
Summary of Contents for EcoLab 3.0
Page 1: ...User Guide EcoLog XL EcoLab 3 0 Integrating student computing science...
Page 2: ...EcoLog XL User guide Third Edition First Print Printed in April 2005...
Page 3: ......
Page 13: ......
Page 111: ...110 EcoLab The Timing Wizard Between gates Result 1 3 t t t t1 t2 t3 t4 Input 1 Input 2...
Page 112: ...EcoLab The Timing Wizard 111 Pendulum one gate Result 1 5 t t t t5 t3 t1 t2 t4...
Page 133: ...132 EcoLab Workbook 4 Select an option Graph Meter or Timing...
Page 151: ...150 Troubleshooting Guide Reset Button...
Page 165: ...164 Index X X axis values 79 Y Y axis 73 74 Z Zoom 76...


