96
01-28006-0003-20041105
Fortinet Inc.
Managing an HA cluster
System config
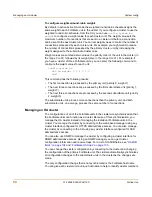
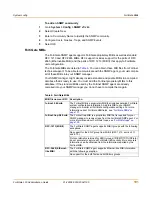
To view and manage logs for individual cluster units
1
Connect to the cluster and log into the web-based manager.
2
Go to
Log&Report > Log Access
.
The Traffic log, Event log, Attack log, Antivirus log, Web Filter log, and Email Filter log
for the primary unit are displayed.
The HA Cluster pull-down list displays the serial number of the FortiGate unit for which
logs are displayed.
3
Select the serial number of one of the FortiGate units in the cluster to display the logs
for that FortiGate unit.
You can view, search and manage logs saved to memory or logs saved to the hard
disk, depending on the configuration of the cluster unit.
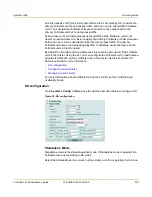
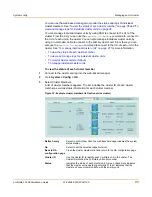
To monitor cluster units for failover
If the primary unit in the cluster fails, the units in the cluster renegotiate to select a new
primary unit. Failure of the primary unit results in the following:
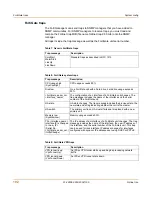
• If SNMP is enabled, the new primary FortiGate unit sends the trap message “HA
switch”. This trap indicates that the primary unit in an HA cluster has failed and has
been replaced with a new primary unit.
• The cluster contains fewer FortiGate units. The failed primary unit no longer
appears on the Cluster Members list.
• The host name and serial number of the primary cluster unit changes.
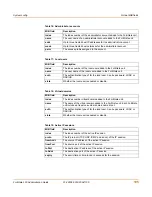
• The new primary unit logs the following messages to the event log:
HA slave became master
Detected HA member dead
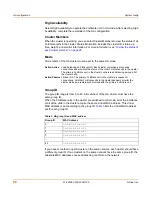
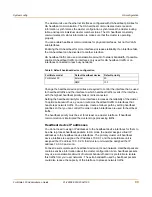
Up Time
The time in days, hours, minutes, and seconds since the cluster unit was
last started.
Monitor
Displays system status information for each cluster unit.
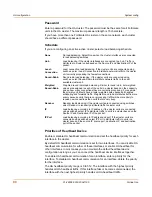
CPU Usage
The current CPU status of each cluster unit. The web-based manager
displays CPU usage for core processes only. CPU usage for
management processes (for example, for HTTPS connections to the
web-based manager) is excluded.
Memory Usage
The current memory status of each cluster unit. The web-based manager
displays memory usage for core processes only. Memory usage for
management processes (for example, for HTTPS connections to the
web-based manager) is excluded.
Active Sessions
The number of communications sessions being processed by the each
cluster unit.
Total Packets
The number of packets that have been processed by the cluster unit
since it last started up.
Virus Detected
The number of viruses detected by the cluster unit.
Network Utilization
The total network bandwidth being used by all of the cluster unit
interfaces.
Total Bytes
The number of bytes that have been processed by the cluster unit since it
last started up.
Intrusion Detected
The number of intrusions or attacks detected by the cluster unit.
Summary of Contents for FortiGate 100
Page 24: ...24 01 28006 0003 20041105 Fortinet Inc FortiLog documentation Introduction ...
Page 72: ...72 01 28006 0003 20041105 Fortinet Inc Transparent mode VLAN settings System network ...
Page 80: ...80 01 28006 0003 20041105 Fortinet Inc DHCP IP MAC binding settings System DHCP ...
Page 114: ...114 01 28006 0003 20041105 Fortinet Inc Access profile options System administration ...
Page 232: ...232 01 28006 0003 20041105 Fortinet Inc CLI configuration Firewall ...
Page 244: ...244 01 28006 0003 20041105 Fortinet Inc peergrp Users and authentication ...
Page 320: ...320 01 28006 0003 20041105 Fortinet Inc service smtp Antivirus ...
Page 366: ...366 01 28006 0003 20041105 Fortinet Inc syslogd setting Log Report ...
Page 380: ...380 01 28006 0003 20041105 Fortinet Inc Glossary ...
Page 388: ...388 01 28006 0003 20041105 Fortinet Inc Index ...


