4-19
Display setup
C1. Display Setup for measurement: Coastdown, Orbit, Phase
The following sections C to E only describe the parameters specific
to the measurement type. Global display parameters, such as 'Zoom'
and 'Cursor', can be found in sections A and B.
Show overall (Coastdown - Overall value): The results screen
displays the RMS value and one of three peak values in
dependence on the RPM. Select the peak value (0-peak, peak-
peak, crest) which is to be displayed as standard.
Plot type (Coastdown - Phase, Orbit): The runup / coastdown
curve can be displayed as a
Bode or Nyquist plot
.
Orbit
(polar
representation) and
single signals
(Cartesian representation) can
be selected for the shaft movement. The
AC only
option shows
the AC component of the signal.
Show amplitude as (Coastdown curve - Phase vector): Amplitudes
can be displayed as an RMS value or a peak value (
0-p
).
Continuous phase (Coastdown - Phase with Bode plot): The scale of
the phase axis begins at 0° and ends at 360°. If the curve runs
beyond the 360° mark during the measurement, it is continued
unchanged at 0° (
No
). If you select the
Yes
option, the phase axis
continues beyond 360° - beginning again at 0° - and the phase
progression is continually displayed (see page 5-6).
Speed Marker (Orbit): See section B1.
Continuous measurement (live mode): see section X on page 4-17.
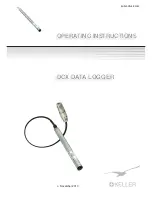
Left:
Display setup for Coastdown
(Phase-RPM)
Right:
Display setup for shaft vibration (Orbit)
Summary of Contents for VIB 5.310
Page 1: ...Data Collector Vibration Analyzer VIBXPERT II Users Manual ...
Page 9: ...1 8 Empty page ...
Page 51: ...2 38 Empty page ...