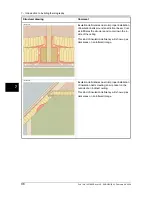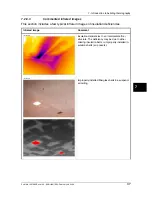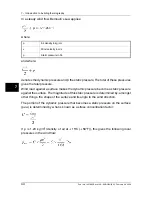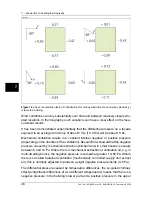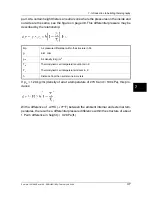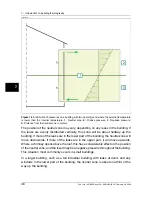
In practice the method involves the following:
Laboratory or field tests are used to produce an expected temperature distribution in
the form of typical or comparative infrared images for common wall structures, com-
prising both defect-free structures and structures with in-built defects. Examples of
typical infrared images are shown in section 7.2 – Typical field investigations beginning
on page 17.
If infrared images of structural sections taken during field measurements are intended
for use as comparison infrared images, then the structure’s composition, the way it
was built, and the measurement conditions at the time the infrared image was taken
must be known in detail and documented.
In order, during thermography, to be able to comment on the causes of deviations
from the expected results, the physical, metrological and structural engineering pre-
requisites must be known.
The interpretation of infrared images taken during field measurements may be de-
scribed in brief as follows:
A comparison infrared image for a defect-free structure is selected on the basis of
the wall structure under investigation and the conditions under which the field mea-
surement was taken. An infrared image of the building element under investigation
is then compared with the selected infrared image. Any deviation that cannot be ex-
plained by the design of the structure or the measurement conditions is noted as a
suspected insulation defect. The nature and extent of the defect is normally determined
using comparison infrared images showing various defects.
If no suitable comparison infrared image is available, evaluation and assessment are
done on the basis of experience. This requires more precise reasoning during the
analysis.
When assessing an infrared image, the following should be looked at:
■
Uniformity of brightness in infrared images of surface areas where there are no
thermal bridges
■
Regularity and occurrence of cooled surface areas, e.g. at studding and corners
■
Contours and characteristic shapes in the cooled surface area
■
Measured temperature differences between the structure’s normal surface temper-
ature and the selected cooled surface area
■
Continuity and uniformity of the isotherm curve on the surface of the structure. In
the camera software the isotherm function is called
Isotherm
or
Color alarm
, de-
pending on camera model.
7
50
Publ. No. 1557882 Rev. a156 – ENGLISH (EN) – February 28, 2006
7 – Introduction to building thermography
Summary of Contents for ThermaCAM B2
Page 2: ......
Page 4: ......
Page 6: ......
Page 7: ...ThermaCAM B2 User s manual Publ No 1557882 Rev a156 ENGLISH EN February 28 2006...
Page 191: ......

