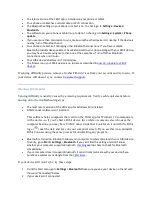
1.
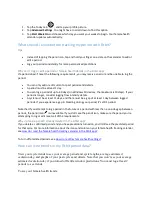
Tap the Today tab
, then tap the female health tile > Trends to view your period trends.
2.
Tap a cycle to see more details, including an overview of the details you logged.
How do I read the graphs of my cycle details in the Fitbit app?
To see the trends for each detail you logged during a cycle:
1.
Tap the Today tab
, then tap the female health tile > Trends.
2.
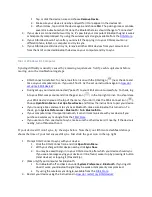
Tap a cycle to see more details.
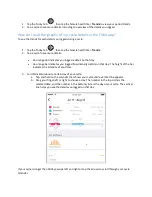
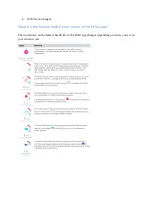
An orange dot indicates you logged a detail on that day.
An orange bar indicates you logged flow intensity details on that day. The height of the bar
indicates the intensity of your flow.
3.
For information about a certain day of your cycle:
a.
Tap and hold on the calendar that shows your cycle until a vertical line appears.
b.
Drag your finger left or right to choose a day. The number in the top circle is the
selected date, and the number in the bottom circle is the day of your cycle. The vertical
line helps you see the details you logged on that day.
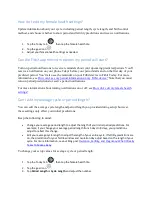
If your cycle is longer than 60 days, swipe left and right or tap the arrows to scroll through your cycle
calendar.


