


24
MSR128LUS/MSR128LUV USERS MANUAL EM-7375 Rev.2
5.2
ELEMENTS ON THE RECORD VIEW
Start / Stop
This is used to turn the recorder on and off. When the switch is OFF, pens are invisible on the Pen Panel, and no
recording is executed. When it is turned ON, pen points other than those specified as Disable start plotting.
While the recorder is operating, the Start button is replaced with the Stop button.
Retrieve
Clicking Retrieve button switches the screen to the Retrieve view. Refer to Section 6.
Digital / Hide
The digital meters (indicators) showing instantaneous value of each enabled pen appear at the lower half of the
screen when Digital button is clicked.
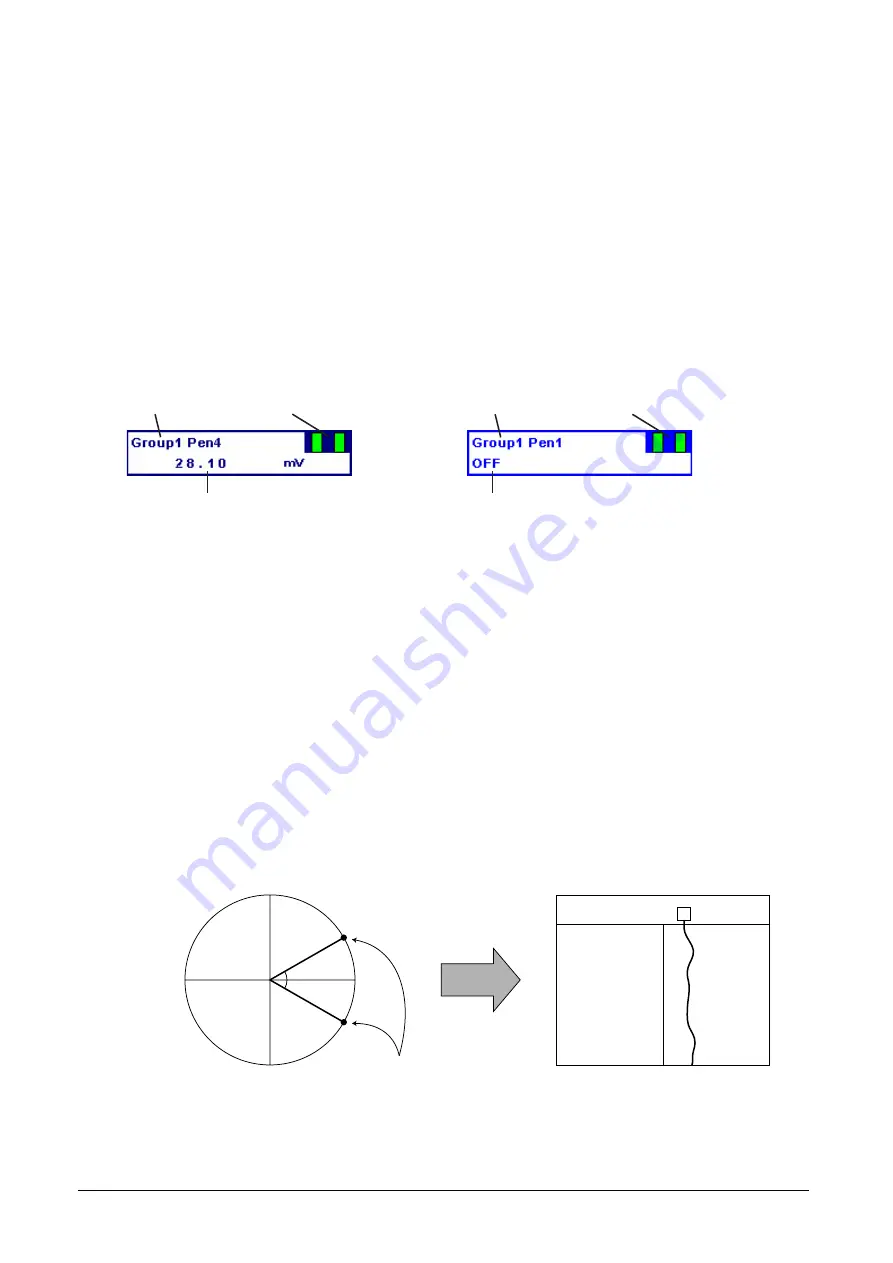
Digital displays include the tag name selected in the Pen Setting, alarm status, and analog engineering unit value or
discrete signal status description, in specified pen colors.
While the digital display area is indicated, the Digital button is replaced with the Hide button. Click Hide button to
hide the digital meters/indicators.
Figure 5.2a: Digital display, analog signal.
Figure 5.2b: Digital display, discrete signal.
Scale Bar
Two scales, linear and square root from 0 to 100%, are indicated on the scale bar. The scales apply to the plot range
specified in Pen Setting.
Engineering scale for a specific pen can replace the standard scale by clicking the digital meter/indicator for the pen.
In order to return the scale to 0 to 100%, click the scale.
If you want the scale with fractions, specify the decimals for the plot range in Pen Setting. With the plot range set to
a integer, the scale divisions are also rounded to integers. Decimals setting is applicable only to the perpendicular
chart.
Chart
Perpendicular and horizontal charts are selectable. On the perpendicular chart, data stream from top to bottom. On
the horizontal chart, data stream from left to right or vice versa.
Analog data trend is plotted in the Plot Range specified in Pen Setting. Discrete data trend (square wave) is plotted
on the screen, each pen position offset by one-twelfth of the full-scale range.
Power Factor (PF) is represented on the screen based on the power factor data and the Phase Direction (DIR) data
(0 = LAG, 1 = LEAD). It ranges from -1.0 (LEAD) at the left end of the chart, to 1.0 in the middle, to -1.0 (LAG) at the
right end of the chart.
TAG NAME
ALARM INDICATORS
DESCRIPTION
TAG NAME
ALARM INDICATORS
INSTANTANEOUS VALUE + UNIT
0
0
-1.0
1.0
θ
θ
Power Factor data alone
cannot determine the plot point.
LEAD or LAG is determined using
Phase Direction (DIR) data.
1.0
-1.0
-1.0
LEAD
LAG
Input range, Engineering range and Plot position are NOT available for change.
DIR data is irrelevant for the maximum and minimum power factor values. Therefore no reference to DIR data
is used to plot these values on the screen.
DIR data cannot be included in retrieved data. Power Factor data is directly read in and plotted on the screen.
NOTES
1.
2.
3.


