11
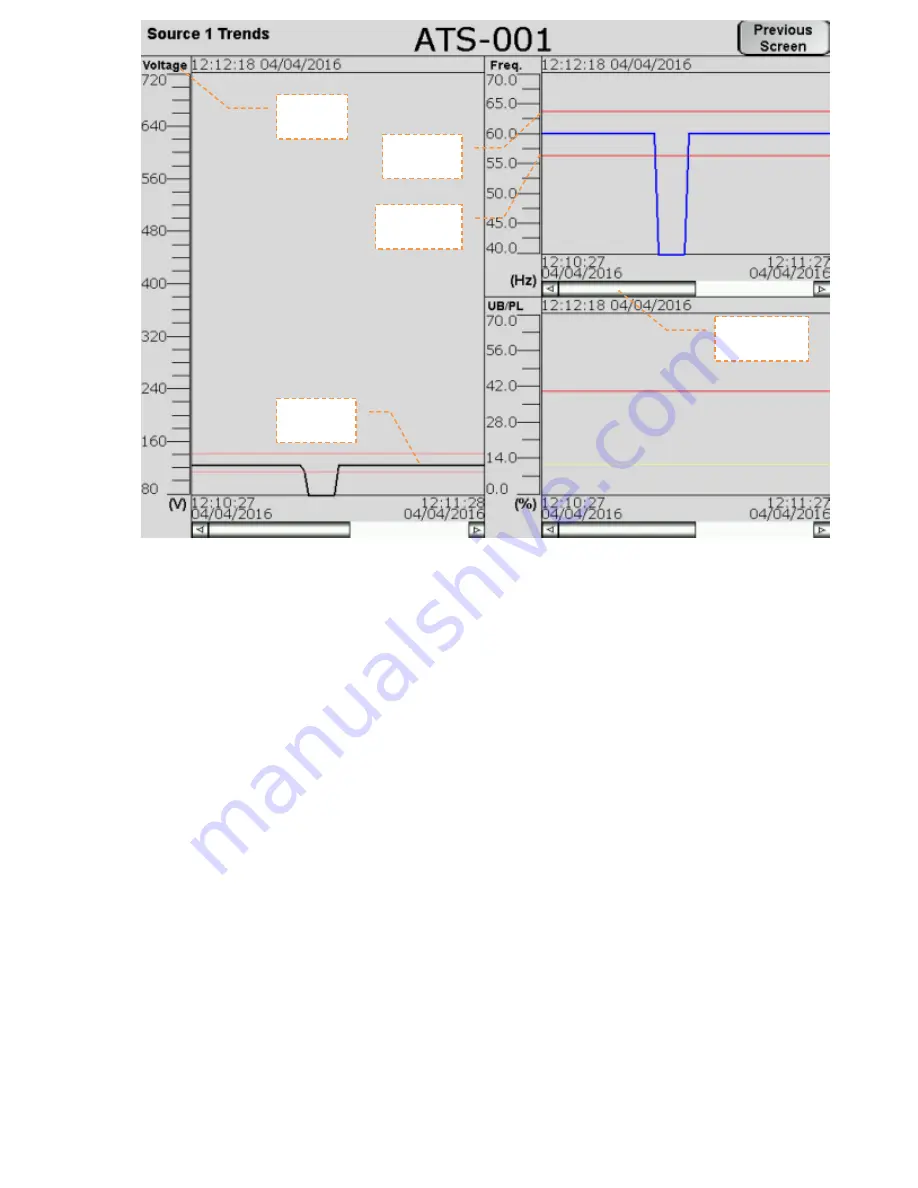
The Trend screens show a graphical representation of Voltage, Frequency,
Unbalance, and Amperage (Load trend only). The HMI takes data samples every 1
second for each controller it communicates to. The internal storage of the HMI can
store up to 5.25 days of historical data on the single-view firmware, and up to 8.9
hours of historical data on the multi-view firmware. The HMI can be configured from
the factory to export and store this data on an external USB drive or SD card.
Additionally, data saved to external devices can be viewed on any PC program that
supports CSV files.
If applicable, the trend windows also display the Under/Over-Frequency, Voltage, and
Unbalance limits as set in the ATC-900. These are depicted by the red horizontal lines
on each trend window.
To view trend data on the HMI, simply press the Trend button of the voltage source
you wish to view (Source 1, Source 2, or Load). Once on the trend screen, you can go
back and forth through time by using the scroll bar and arrows on the bottom of each
trend window. The most recent data is on the
right
side of the window, while the oldest
data is on the
left
side. To see a data point value at a specific point in time, press on
the screen at the desired point and the HMI will draw a vertical line there and display
the data value.
Navigation
Sliders
Trend
Label
Current
Data Pen
Overfreq.
Range
Underfreq.
Range
Summary of Contents for HMIVU07CUNBE
Page 9: ...9 ...


