


IFU00022vJ
6
continued use throughout the study period of four months. Table 1 presents the adverse events by type,
frequency of occurrence and resolution status at the conclusion of the study.
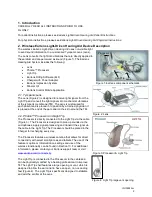
8.3. Effectiveness Outcomes
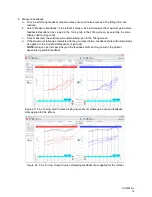
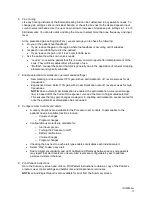
The primary efficacy endpoint was intended to demonstrate device effectiveness by improving speech
recognition using the Northwestern Auditory Test No.6 (NU-6) test of word recognition with the Earlens
Hearing Aid at a speech level of 45 dB HL. The objective was to show that the Earlens Hearing Aid
provides a statistically significant improvement in mean aided word recognition at 30 days post placement
when compared to the baseline unaided condition measured prior to placement. The average baseline
unaided score was 52% and the average aided score was 85% (Figure 7); this improvement was
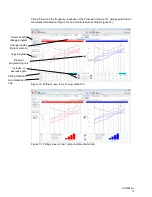
statistically significant (p<0.0001). A secondary measure of device effectiveness was defined as more
than 10 dB improvement (functional gain) in thresholds over the range of frequencies from 2,000 to
10,000 Hz for aided measured at 30 days post placement when compared to unaided measured prior to
placement. Mean functional gain was 30.5 dB (p<0.0001), indicating that the Earlens Hearing Aid was
able to deliver significant functional gain (Figure 8). Functional gain reached a maximum of 68 dB at 9-10
kHz.
An additional measure of device effectiveness was perceived benefit as measured by the Abbreviated
Profile of Hearing Aid Benefit (APHAB). The average baseline unaided percentage of communication
difficulties was 58% (standard deviation = 16%), the percentage of difficulties decreased to 30%
(standard deviation = 13%) with the subject’s own air conduction hearing aid, and for Earlens it was 29%
Table 1: Adverse events across study period
-10
0
10
20
30
40
50
60
70
80
90
100
110
120
100
1,000
10,000
H
ear
ing Lev
el
(
dB
H
L)
Frequency (Hz)
Sound field Threshholds (n = 78 ears)
Aided 30-
day
Baseline
Unaided
0
10
20
30
40
50
60
70
80
90
100
Unaided baseline
Aided 30-day
P
er
c
ent
C
or
rec
t (
%
)
Word Recognition (n = 78 ears)
Figure 7: Word Recognition
Figure 8: Sound field thresholds


