


Leaders in Pipelin
e Survey Systems
C
C
C
-
-
-
S
S
S
C
C
C
A
A
A
N
N
N
2
2
2
0
0
0
1
1
1
0
0
0
SYSTEM MANUAL Version 6.03i
38
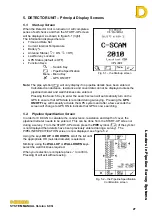
This final screen provides a summary of the information
before the data is permanently stored in memory.
As with the Start Point, the Depth, Cover and
Distance/Chainage information is shown, but as the
Detector now has distance information from the
previous survey point, values of Conductance and
Resistance can now be displayed as in Fig 6.11. In this
example, the following are shown:
•
Conductance: 195µS/m2 – micro-siemens per m
2
•
Resistance:
5.13k
Ω
.m2 – kilohms.m
2
These figures relate to the coating condition allowing for
pipeline diameter and wall thickness.
Finally, the
START
text denoting a Start Point has been
replaced with the attenuation (
) figure for that section of pipeline, in this instance 2.21
mB/m – millibels per metre.
The attenuation value in mB/m, is the absolute rate of loss of signal current from the
pipeline over any given section, in this example section #000
#001. It is independent of
the value of the initial signal set on the Signal Generator and of the ground conditions. It is
solely determined by the average condition of the coating between the two locations and
by the area of pipeline coating in contact with the ground, per metre of pipeline – the
pipeline diameter. For a pipeline of a given diameter, the attenuation value is an absolute
indicator of dielectric performance of the coating; the lower the figure, the better. If
comparing two pipelines of different diameters but with identical coating dielectric
performance, the attenuation values will be proportional to the diameter.
For more information about attenuation values, see section 7.2
Press the key now to store the data and continue.
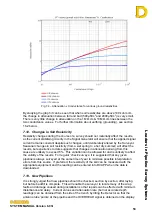
6.4.7. Graphs
If any survey data is stored in the Detector’s memory,
the Operator has the option to view this data in
graphical form to aid in identifying any anomalies in the
coating without having to download the data or leave
the field. These graphs can be accessed at any time
via the BROWSE screen, but the operator is given the
option to view them after each survey point stored.
The graphs available are:
CUMULATIVE ATTENUATION
[
] – shows the
attenuation and distance between the current survey
point and all previous survey points of the current
survey. This is not available during BROWSE mode.
GPS POSITION PLOT
[
] – this shows a plan view of the pipeline to scale.
ATTENUATION PLOT
[
] – a bar graph of the attenuations recorded during this survey
CURRENT PLOT
[
] – shows the absolute current over the surveyed sections
DEPTH PLOT
[
] – shows the depth to: the centre-line [
] of the pipeline, or
depth of cover [
].
Fig. 6.12 – Graphs screen
Fig. 6.11 – Summary screen