


Manual, Ultra High Sensitivity Aerosol Spectrometer (UHSAS)
DOC-0210 Rev E-4
3 1
© 2017 DROPLET MEASUREMENT TECHNOLOGIES
4)
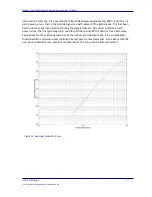
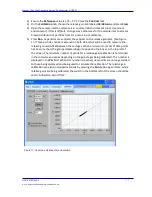
With your collection of particles, note in which gain stage each particle will be
measured by looking at the size of the particle and the calibration curve. The red dots
on the calibration curve indicate the saturation levels of each gain stage—i.e., the
largest particles measureable on each stage. For example, the region below the first
red dot is covered by G3, the region between the first and second red dots is covered
by G2, etc. See Figure 18.
5)
Choose a particle size and begin introducing particles to the sample inlet of the
UHSAS.
6)
Go to the
Map
tab and set up a voltage bin map:
a.)
Press
Volts.
b.)
Choose a gain stage (G3, G2, G1 or G0) appropriate to the particle size.
c.)
Set the range as 100 to 10000 mV.
d.)
Press
Linear.
e.)
Press
Commit.
7)
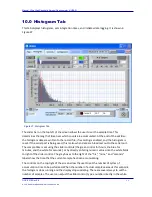
Go to the histogram page and note the peak of the voltage histogram.
8)
Return to the
Calibration
tab and the
Calibration Curve
sub-tab.
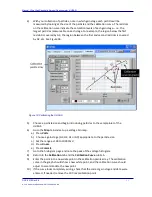
9)
Enter the point into a new data point in the calibration points array. The calibration
curve in the graph should show a new white point, and the calibration curve should
adjust to accommodate the new point.
10)
If the curve looks completely wrong, check that the correct gain stage and data were
entered. If needed, remove the 100 nm calibration point.
Figure 18: Calibrating the UHSAS


