


Smart Monitor User’s Guide
59
3
3
.
.
5
5
R
R
e
e
p
p
o
o
r
r
t
t
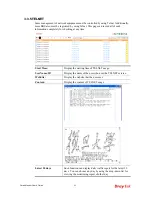
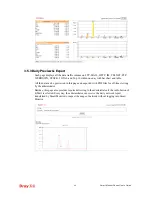
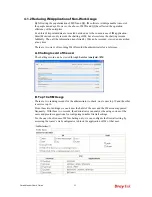
This menu lists reports for service traffic, statistics and daily preview/export.
3
3
.
.
5
5
.
.
1
1
S
S
e
e
r
r
v
v
i
i
c
c
e
e
T
T
r
r
a
a
f
f
f
f
i
i
c
c
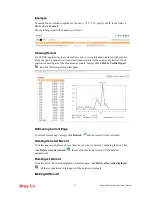
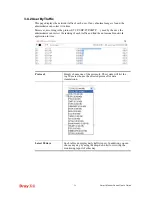
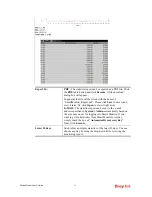
Such page displays the percentage for the traffic of each service that users have accessed.
Latest 20 days
Such table can display daily traffic report. In addition, you can
choose any day by using the drop-down list for viewing the
monitoring report of other day.
3
3
.
.
5
5
.
.
2
2
S
S
t
t
a
a
t
t
i
i
s
s
t
t
i
i
c
c
s
s
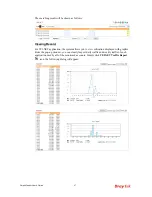
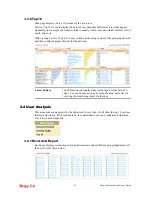
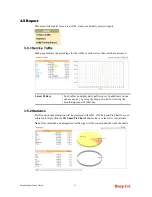
Traffic and storage utilization will be displayed with table, 3D Chart and Pie Chart for your
reference. Simply click the
3D Chart/Pie Chart
button to have a clear view for statistics.
Note
: Only identified and categorized traffic types will be counted and shown in the charts.
Summary of Contents for Smart Monitor
Page 1: ...i ...
Page 6: ......
Page 11: ...Smart Monitor User s Guide 5 etc init d smartmonitor start ...
Page 12: ...Smart Monitor Series User s Guide 6 This page is left blank ...
Page 22: ...Smart Monitor Series User s Guide 16 This page is left blank ...
Page 68: ...Smart Monitor Series User s Guide 62 This page is left blank ...