37
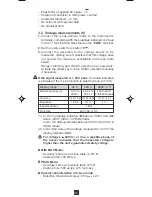
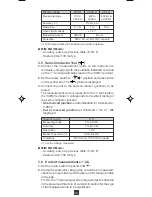
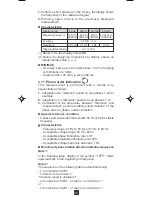
1. Perform a short pressing on the Hz key, the display shows
the frequency of the measured signal.
2. Pressing again returns to the previously displayed
measurement.
■
■
■
■
■
Characteristics
Display range
40 Hz
400 Hz 4000 Hz
40 kHz
Measuring range
(1)
10.00 to
40.0 to
400 to
4.00 kHz to
39.99 Hz 399.9 Hz 3999 Hz 19.99 kHz
Accuracy
0.4% R +1 ct
Resolution
0.01 Hz
0.1 Hz
1 Hz
10 Hz
Triggering threshold
(2)
5 V or 10 A
(1) Below 5 Hz, the display shows 0.0
(2) Below the triggering threshold, the display shows an
indeterminate value (- - - -).
■
■
■
■
■
MIN/MAX
- Accuracy: same as in the table above +0.2% of reading
with limitation to 5 kHz.
- Capture time: 125 ms typ. every 400 ms
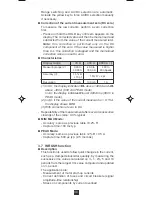
3.11 Phase order indication
1
2
3
This measurement is performed with 2 cables only,
sequentially as follows:
1. Integration of a “reference” period on one phase L1-L2 for
example
2. Integration of a “reference” period on one phase L1-L3
3. Calculation of the time delay between “reference” and
“measurement” periods enabling determination of the
phase order or phase rotation direction
■
■
■
■
■
Special reference condition
- 3-phase and sinusoidal network with 50 Hz or 60 Hz stable
frequency
■
■
■
■
■
Characteristics
- Frequency range: 47 Hz to 53 Hz or 57 Hz to 63 Hz.
- Acceptable voltage range: 50 V to 600 V
- Acceptable phase imbalance rate: ±10°
- Acceptable amplitude imbalance rate: 20%
- Acceptable voltage harmonic distortion: 10%
■
■
■
■
■
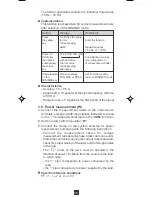
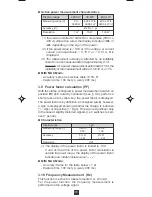
Running of phase rotation direction detection sequence
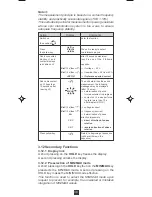
Note 1:
In the following table, display of the symbol "
" refers
systematically to the beginning of sequence
Note 2:
The sequence of the following table is described using:
- L1 on terminal “COM”
- L2 then L3 on terminal “+”
The same result is obtained if:
- L2 on terminal “COM” , L3 then L1 on terminal “+”
or:
- L3 on terminal “COM” , L1 then L2 on terminal “+”


