background image

46 

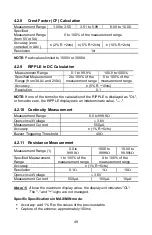
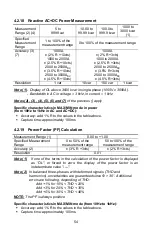
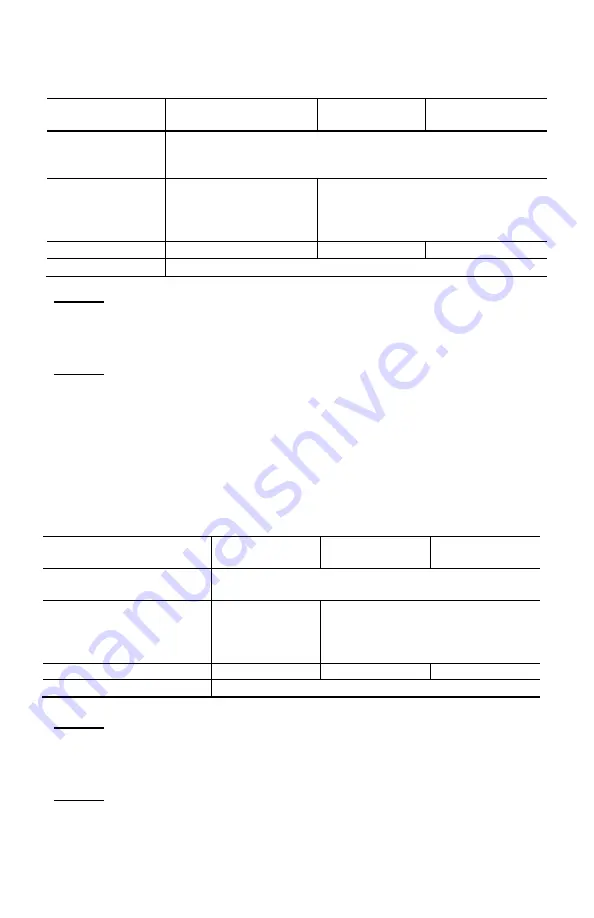
  AC Voltage Measurement 

4.2.2

Measurement 

Range 

0.15 to 

99.99V 

100.0 to 

999.9V 

1000V RMS 

1400V peak (1) 

Specified 

Measurement 

Range (2) 

0 to 100% of the measurement range 

Accuracy 

0.15 to 9.99V 

± (1% R +10cts) 

10.00 to 99.99V 

± (1% R +3cts) 

± (1% R +3cts) 

Resolution 

0.01V 

0.1V 

1V 

Input Impedance 

10M


Note (1)

 -  Above 1000V (RMS), a repetitive beep indicates the measured 

voltage is greater than the instrument’s specified safety voltage. The 

display indicates "OL". 

-

Bandwidth in AC = 3 kHz

Note (2)

  Any value between zero and the min. threshold of the measurement 

range (0.15V) is forced to show "----" on the display. 

Specific Specifications in MAX/MIN mode


(from 10Hz to 1kHz, and from 

0.30V in AC):


Accuracy: add 1% R to the values of the table above.

Capture of the extreme: approximately 100ms.

  AC+DC Voltage Measurement 

4.2.3

Measurement Range (2) 

0.15 to 

99.99V 

100.0 to 

999.9V 

1000V RMS (1) 

1400V peak 

Specified Measurement 

Range 

0 to 100% of the measurement range 

Accuracy 

0.15 to 9.99V 

± (1% R +10cts) 

10 to 99.99V 

± (1% R +3cts) 

± (1% R +3cts) 

Resolution 

0.01V 

0.1V 

1V 

Input Impedance 

10M


Note (1)

 -


The display indicates "OL" above 1000V (1400V in PEAK mode). 

Above 1000V (DC or RMS), a repetitive beep indicates the measured 

voltage is greater than the instrument’s specified safety voltage. 

-

Bandwidth in AC = 3 kHz

Note (2)

  Any value between zero and the min. threshold of the measurement 

range (0.15V) is forced to "----" on the display. 

Summary of Contents for AEMC 2139.61

Page 1: ...607 POWER CLAMP ON METER User Manual ENGLISH ...

Page 2: ...2 ...

Page 3: ...16 2 5 BUTTON 16 2 5 1 Normal Mode 16 2 5 2 MAX MIN Mode HOLD Mode 17 2 5 3 True Inrush Mode set switch to 18 2 6 BUTTON 18 2 6 1 Normal Mode 19 2 6 2 Harmonic Order Display or 19 2 6 3 Hz Function HOLD Mode 19 3 USE 20 3 1 BATTERY INSTALLATION 20 3 2 TURNING ON THE METER 20 3 3 TURNING OFF THE METER 20 3 4 CONFIGURATION 21 3 4 1 Auto Power Off 21 3 4 2 Current Threshold for True InRush 21 3 4 3 R...

Page 4: ...DING DATA 42 3 17 1 Starting a Recording Session 42 3 17 2 Stopping a Recording Session 42 3 18 DOWNLOADING RECORDED DATA 42 3 19 ERASING DATA FROM MEMORY 42 3 20 DATA STORAGE 43 3 20 1 Trend Measurements 43 3 20 2 Recording with Memory Cleared 43 3 20 3 Recording with a Partial or Full Memory 43 3 20 4 Memory Filled During Recording Session 43 3 21 DATAVIEW SOFTWARE INSTALLATION 43 3 22 OPENING T...

Page 5: ... Factor DPF Calculation 55 4 2 21 Frequency Measurements 55 4 2 22 THDr Specifications 56 4 2 23 THDf Specifications 56 4 2 24 Harmonic Measurement Specifications 56 4 3 ENVIRONMENTAL CONDITIONS 57 4 4 MECHANICAL SPECIFICATIONS 57 4 5 POWER SUPPLY 57 4 6 COMPLIANCE WITH INTERNATIONAL STANDARDS 57 4 7 ENVIRONMENTAL VARIATIONS 58 5 MAINTENANCE 59 5 1 WARNING 59 5 2 CLEANING 59 5 3 BATTERY REPLACEMEN...

Page 6: ... in all cases where this symbol is marked Risk of electric shock The voltage at the parts marked with this symbol may be dangerous Refers to a type A current sensor This symbol signifies that application around and removal from HAZARDOUS LIVE conductors is permitted 1 5 V battery Indicates compliance with European directives Double insulation or reinforced insulation In the European Union this pro...

Page 7: ...Before each use check the condition of the insulation on the leads housing and accessories Any element of which the insulation is deteriorated even partially must be set aside for repair or scrapped Use leads and accessories rated for voltages and categories at least equal to those of the instrument If not an accessory of a lower category lowers the category of the combined clamp accessory to that...

Page 8: ...equipment appears to be damaged file a claim immediately with the carrier and notify your distributor at once giving a detailed description of any damage Save the damaged packing container to substantiate your claim ORDERING INFORMATION Clamp on Meter Model 607 Cat 2139 61 Includes set of 2 color coded silicone insulated test leads test probes and alligator clips hard carrying case 4x1 5V AA batte...

Page 9: ...armonic rank value A and V up to the 25th Continuity test with buzzer Resistance measurement Power W VA var and PF and Energy measurements Crest Factor CF the Displacement Power Factor DPF and RIPPLE measurement Recording of data in memory wireless transfer via Bluetooth to a PC Item Description See 1 Jaws with centering marks 3 5 to 3 13 2 Physical guard 3 Rotary function switch 1 1 4 Function bu...

Page 10: ...ble below Figure 2 Function Rotary Switch Item Function See 1 OFF mode Turns the clamp on meter off 3 3 2 AC DC AC DC voltage measurement V 3 5 3 Continuity test Resistance measurement Ω 3 6 3 7 4 AC DC AC DC current measurement A 3 8 5 Power measurements W var VA AC DC AC DC Power factor PF displacement power factor DPF and energy calculation 3 10 1 2 3 4 5 ...

Page 11: ...orders of harmonics or of pages of results in W MAX MIN PEAK Enables disables Bluetooth wireless transfer in combination with 6 below 2 3 4 Enables disables the MAX MIN PEAK mode Enables disables the True InRush mode in A 2 5 5 Measures frequency Hz total harmonic distortion THD and orders of harmonics Enables disables the energy metering mode 2 6 6 Scrolls down the orders of harmonics or of pages...

Page 12: ...splay 2 Display Symbols 1 3 1 Symbol Description AC Alternating current or voltage DC Direct current or voltage AC DC Alternating and direct current Storage of the values and display hold RMS RMS value Max Maximum DC or RMS value Min Minimum DC or RMS value AVG Mean RMS value PEAK Maximum peak value PEAK Minimum peak value Balanced total 3 phase power measurement V Volt Hz Hertz W Active power A A...

Page 13: ...istortion with respect to the true RMS value of the signal REC Recording in memory Bluetooth wireless communication Continuity test Auto power off disabled Low battery indicator Measurement Capacity Exceeded OL 1 3 2 The OL Over Load symbol is displayed when the display capacity is exceeded 1 4 TERMINALS The terminals are used as follows 1 2 Figure 5 Terminals Item Function 1 COM black Input Termi...

Page 14: ...t display is then maintained while the detection and acquisition of new values continues Perform automatic zero correction in ADC AC DC and WDC AC DC see 3 9 2 Successive presses on Function First press Holds the last value displayed Second press Returns to normal display mode the value of each new measurement is displayed long 2 sec ADC AAC DC WDC WAC DC Performs automatic zero correction see 3 9...

Page 15: ... power of a balanced system is displayed Press again to return to the display of the single phase power is off 2 3 BUTTON This button is used to Scroll up through the order of harmonics or successive pages Activate the backlighting Activate the Bluetooth function Successive presses on Function short Scrolls through the various pages of measurement results depending on the function and possibly the...

Page 16: ...he recording memory is full the REC symbol flashes combined with the button Activates Bluetooth wireless communication The symbol is displayed NOTE Activation of Bluetooth mode automatically stops the recording of the data 2 5 BUTTON Normal Mode 2 5 1 This button activates the detection of the MAX MIN PEAK PEAK or AVG values of the measurements made Max and Min are the extreme mean values in DC an...

Page 17: ... the MAX MIN and AVG value successively Returns to the display of the present measurement without exiting from the mode the values already detected are not erased long 2 sec Exits the MAX MIN PEAK mode The values previously recorded are then erased NOTE If the HOLD function is enabled it is not possible to exit from the MAX MIN PEAK mode The HOLD function must first be disabled first MAX MIN Mode ...

Page 18: ...n and acquisition the InRush current measurement is displayed after the calculations stage backlighting off NOTE The A symbol flashes to indicate surveillance of the signal Second press Exits the True InRush mode returns to simple current measurement short 2 sec Note A short press is functional only if a True InRush value has been detected Displays the PEAK value of the current Displays the PEAK v...

Page 19: ...C DC modes is the DC component order h01 is the fundamental Starts Stops the energy metering mode Displays the various energy parameters The and buttons are used to display the status and energy metering measurement results pages Harmonic Order Display or 2 6 2 Successive presses on Function short First press Displays the frequency of the harmonic order previously selected using the or buttons ins...

Page 20: ...ry switch set in the OFF position turn the switch to the desired function The display lights all symbols for a few seconds see 1 3 then the selected function screen is displayed The clamp on meter is now ready to make measurements 3 3 TURNING OFF THE INSTUMENT The clamp on meter can be turned off in two ways Manually Turn the switch to the OFF position Automatically After ten minutes with no activ...

Page 21: ...t 1 In the OFF position hold the button down while turning the switch to until the full screen display ends and a beep is emitted The display will indicate the percentage overshoot to apply to the measured current to determine the measurement triggering threshold The value stored by default is 10 representing 110 of the established current measured The possible values are 5 10 20 50 70 100 150 and...

Page 22: ...Memory 3 4 4 To erase a recording from memory perform the following NOTE Make sure there is no voltage on the input terminals 1 In the OFF position hold the yellow button down while turning the switch to 2 The device emits a beep after erasing the records in memory The rSt and rEC symbols are displayed 3 The device then switches to normal continuity measurement Default Configuration 3 4 5 To reset...

Page 23: ...to be measured The device selects AC or DC automatically according to which measured value is larger The AC or DC symbol displays blinking in auto detect mode To select AC DC or AC DC manually press the yellow button to toggle between them The symbol corresponding to the choice will then display The measured value is displayed In DC Display Quantity 1 st row Voltage V RMS 2 nd row DC RIPPLE in 3 r...

Page 24: ...make sure that the circuit is off and all capacitors have been discharged 1 Set the switch to The symbol is displayed 2 Connect the black lead to the COM terminal and the red lead to the terminal 3 Connect the test probes or the alligator clips to the circuit or component to be measured An audible signal is emitted if there is continuity and the measured value is dis played on the screen ...

Page 25: ...ow on the jaws of the clamp on meter see the following diagram should point in the presumed direction of current flow from the generator to the load Make sure that the jaws have closed correctly after clamping around the conductor NOTE The measurement results are optimal when the conductor is centered in the jaws aligned with the centering marks The device selects AC or DC automatically according ...

Page 26: ... DC Zero Important The clamp must not be closed on the conductor during the DC zero correction Hold the clamp in the same position during the whole procedure so that the correction value will be exact Press the button until the device emits a double beep and displays a value near 0 The correction value is stored until the clamp is powered down NOTE The correction is effected only if the value disp...

Page 27: ...C or AC DC by pressing the yellow button until the desired choice is reached 2 Clamp the jaws around the conductor to be measured The measured values are displayed In DC Display Quantity 1st row Current A RMS 2nd row DC RIPPLE in 3rd row DC current component ADC ...

Page 28: ... 2 Perform a long press on the button The InRh symbol is displayed along with the triggering threshold The clamp then awaits detection of the True InRush current is displayed and the A symbol flashes 3 After detection and acquisition for 100 ms the RMS value of the True InRush current is displayed Pressing the button will display the PEAK PEAK values subsequently 4 A long press on the button or a ...

Page 29: ...29 Display Quantity 1st row Inrh 2nd row True Inrush value in A 3rd row Triggering threshold in A PEAK Display Quantity 1st row Inrh 2nd row PEAK or PEAK value in A 3rd row Triggering threshold in A ...

Page 30: ...until the desired choice is reached 2 The device automatically displays AC DC To select AC DC or AC DC press the yellow button until the desired choice is reached 3 Connect the black lead to the COM terminal and the red lead to the terminal 4 Connect the test probes or the alligator clips of the black lead on the neutral N then those of the red lead on the L phase 5 Clamp around only the correspon...

Page 31: ... the COM terminal and the red lead to the terminal 5 Connect the leads and the clamp to the circuit as follows If the red lead is connected to the and the black lead is connected to the then the clamp is on the conductor of the L1 phase L2 phase L3 phase L2 phase L3 phase L1 phase L3 phase L1 phase L2 phase NOTE The arrow on the jaws of the clamp see the diagram below must point in the presumed di...

Page 32: ... then multiplying the value by three Four Quadrant Diagram 3 10 3 To correctly determine the sign of the active and reactive powers refer to the diagram below which determines positive active power W power consumed negative active power power generated reactive power var and active power of the same sign inductive power reactive power and active power of opposite signs capacitive power Consumed Ge...

Page 33: ...e switch to 2 Press the long press Start up screen 1 in the Energy Metering mode appears The display reads Counting Off 3 Connect the black lead to the COM terminal and the red lead to the terminals 4 Place the test probes or the alligator clips of the black lead on the neutral N then those of the red lead on the L phase 5 Clamp around only the corresponding conductor respecting the direction of c...

Page 34: ...erved Hour meter page The duration of the metering uses the following format XXXh for hours XXm for minutes XXs for seconds NOTE Beyond 999h 59m 59s h m s is displayed but the internal metering duration keeps running correctly View of the set of screens concerning Energy measurement by short presses on or buttons 1 hours h 2 minutes n 3 seconds s ...

Page 35: ...ived by the load Load side press the button to view each screen that has the term LoAd at the bottom of the screen The sequence of use is as follows I Load h W Load L h VAR Load C h VAR Load h VA I I I Example of LoAd screen 8 To access the screens displaying energies generated by the load and therefore received by the source Supply side press the button to view the screens that have the term SuPP...

Page 36: ...of zero crossings positive going edges Frequency Measurement V 3 12 1 To measure the frequency in voltage proceed as follows 1 Set the switch to and press the button The Hz symbol is displayed 2 Select AC by pressing the yellow button until the desired choice is displayed 3 Connect the black lead to the COM terminal and the red lead to the terminal 4 Connect the test probes or the alligator clips ...

Page 37: ...da mental THDf the total harmonic distortion with respect to the true RMS value of the signal THDr in voltage and in current then the level with respect to the fundamental frequency and RMS value of each order of harmonic The frequency of the fundamental is determined by digital filtering and FFT for the network frequencies of 50 60 400 and 800Hz THD V 3 13 1 1 Set the switch to and press and hold...

Page 38: ...e switch to and press and hold 2s the button The THDf THDr and A RMS symbols are displayed NOTE first press the yellow button to place the meter in AC current measurement mode 2 Apply the clamp to only the conductor concerned The measurement is displayed on screen ...

Page 39: ...e 3 13 1 and in current 3 13 2 1 Press the button Order hdC is displayed DC component only in DC or AC DC The harmonics of higher orders are displayed sequentially as the button is pressed repeatedly The button can be pressed to return to the previous order 2 The button can be pressed to display the frequency of the order of harmonic concerned ...

Page 40: ...ds Max recording time at 1s intervals Max recording time at 600s 10 minute intervals V A Ω 1000 16 minutes 160 hours W 200 3 minutes 35 hours THD 300 5 minutes 55 hours Harmonics 470 8 minutes 80 hours 3 15 CONNECTING TO A COMPUTER Bluetooth Connection 3 15 1 The Model 607 is equipped with Bluetooth connectivity for downloading displaying and deleting recorded data in the instrument s memory The i...

Page 41: ...the instrument has been successfully added to the computer a window will be displayed Select Close 9 You should see the Device listed in the Bluetooth devices window 10 Launch the Power Clamp Control Panel by clicking the icon in the DataView folder placed on the desktop during software installation Refer to 3 21 for DataView software installation The instrument should auto matically connect if on...

Page 42: ...he REC button for 2s 2 The REC indication will not be displayed if a recording is not active 3 18 DOWNLOADING RECORDED DATA Recorded measurements stored in the instrument are transferred to a computer via the download command in the DataView PowerPad Control Panel 3 19 ERASING MEMORY Erasing data from the instrument s memory can be performed in two ways Erasing Memory using the YELLOW button and r...

Page 43: ...he recording amount of memory left and type of recording 3 20 4 Memory Filled During Recording Session If the memory becomes full the REC indication on the display will blink It will be necessary to download and erase the memory before a new recording can be started 3 21 DATAVIEW INSTALLATION 1 Insert the USB drive that comes with the instrument into a USB port on your computer 2 If Autorun is ena...

Page 44: ...y one power meter is connected to the computer it will be selected and a connection will be established automatically The Connection window lists the connected instrument in the Instrument drop down list If multiple units are attached select the desired unit Once the desired instrument has been selected click OK and the Control Panel will attempt to connect to the instrument and download any data ...

Page 45: ...g magnetic field none Electric field none 4 2 SPECIFICATIONS UNDER THE REFERENCE CONDITIONS Accuracy is expressed in x of the reading R y counts ct DC Voltage Measurement 4 2 1 Measurement Range 0 00 to 99 99V 100 0 to 999 9V 1000V 1 Specified Measurement Range 0 to 100 of the measurement range Accuracy 0 00 to 9 99V 1 R 10cts 10 00 to 99 99V 1 R 3cts 1 R 3cts Resolution 0 01V 0 1V 1V Input Impeda...

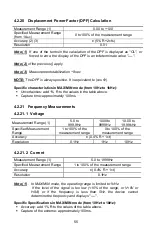
Page 46: ... Specific Specifications in MAX MIN mode from 10Hz to 1kHz and from 0 30V in AC Accuracy add 1 R to the values of the table above Capture of the extreme approximately 100ms AC DC Voltage Measurement 4 2 3 Measurement Range 2 0 15 to 99 99V 100 0 to 999 9V 1000V RMS 1 1400V peak Specified Measurement Range 0 to 100 of the measurement range Accuracy 0 15 to 9 99V 1 R 10cts 10 to 99 99V 1 R 3cts 1 R ...

Page 47: ...R 3 pt 2000 to 2500ADC 2 5 R 3 pt 2500 to 3000ADC 3 5 R 3 pt Resolution 0 01A 0 1A 1A Note 1 The display indicates OL above 3000A Note 2 The residual current at zero depends on the remanence It can be corrected by the DC zero function of the HOLD button AC Current Measurement 4 2 5 Measurement Range 2 0 15 to 99 99A 100 0 to 999 9A 1000 to 2000A 1 Specified Measurement Range 0 to 100 of the measur...

Page 48: ...In DC depends on the remanence This can be corrected by the DC zero function of the HOLD button In AC 150mA Specific Specifications in MAX MIN mode from 10Hz to 1kHz in AC and AC DC Accuracy add 1 R to the values of the table above Capture of the extreme approximately 100ms Specific characteristics in PEAK mode in current from 10Hz to 400Hz in AC and AC DC Accuracy add 1 5 R to the values in the t...

Page 49: ... displayed as OL or forced to zero the RIPPLE displayed is an indeterminate value Continuity Measurement 4 2 10 Measurement Range 0 0 to 999 9Ω Open circuit Voltage 3 6V Measurement Current 550µA Accuracy 1 R 5cts Buzzer Triggering Threshold 40Ω Resistance Measurement 4 2 11 Measurement Range 1 0 0 to 999 9Ω 1000 to 9999Ω 10 00 to 99 99kΩ Specified Measurement Range 1 to 100 of the measurement ran...

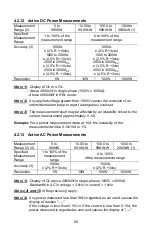
Page 50: ...3 The measurement result may be affected by an instability linked to the current measurement approximately 0 1A Example For a power measurement made at 10A the instability of the measurement will be 0 1A 10A or 1 Active AC Power Measurements 4 2 13 Measurement Range 2 4 5 to 9999W 10 00 to 99 99kW 100 0 to 999 9kW 1000 to 2000kW 1 Specified Measurement Range 1 to 100 of the measurement range 0 to ...

Page 51: ...n of the phase angle between V and I Quadrant 1 Active power P sign power consumed Quadrant 2 Active power P sign power generated Quadrant 3 Active power P sign power generated Quadrant 4 Active power P sign power consumed Note 7 In balanced three phases with deformed signals THD and harmonics uncertainties are guaranteed since Ф 30 Additional errors are following depending of THD Add 1 for 10 THD...

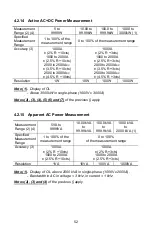
Page 52: ... 10W 100W 1000W Note 1 Display of OL Above 3000kW in single phase 1000V x 3000A Notes 2 3 4 5 6 and 7 of the previous apply Apparent AC Power Measurement 4 2 15 Measurement Range 2 4 5VA to 9999VA 10 00kVA to 99 99kVA 100 0kVA to 999 9kVA 1000 kVA to 2000 kVA 1 Specified Measurement Range 1 to 100 of the measurement range 0 to 100 of the measurement range Accuracy 3 1000A 2 R 10cts 1000 to 2000A 2...

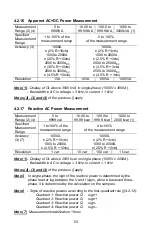
Page 53: ... 10 00 to 99 99 kvar 100 0 to 999 9 kvar 1000 to 2000 kvar 1 Specified Measurement Range 1 to 100 of the measurement range 0 to 100 of the measurement range Accuracy 3 7 1000A 2 R 10cts 1000 to 2000A 2 5 R 10cts 1000A 2 R 3cts 1000 to 2000A 2 5 R 3cts Resolution 1 var 10 var 100 var 1 kvar Note 1 Display of OL above 2000 kvar in single phase 1000V x 2000A Bandwidth in AC in voltage 3 kHz in curren...

Page 54: ...power from 10Hz to 1kHz in AC and AC DC Accuracy add 1 R to the values in the table above Capture time approximately 100ms Power Factor PF Calculation 4 2 19 Measurement Range 1 0 00 to 1 00 Specified Measurement Range 0 to 50 of the measurement range 50 to 100 of the measurement range Accuracy 2 3 R 3cts 2 R 3cts Resolution 0 01 Note 1 If one of the terms in the calculation of the power factor is...

Page 55: ...roximately 100ms Frequency Measurements 4 2 21 4 2 21 1 Voltage Measurement Range 1 5 0 to 999 9Hz 1000 to 9999Hz 10 00 to 19 99kHz Specified Measurement Range 1 to 100 of the measurement range 0 to 100 of the measurement range Accuracy 0 4 R 1ct Resolution 0 1Hz 1Hz 10Hz 4 2 21 2 Current Measurement Range 1 5 0 to 1999Hz Specified Measurement Range 1 to 100 of the measurement range Accuracy 0 4 R...

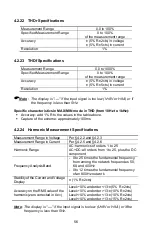
Page 56: ... the extreme approximately 100ms Harmonic Measurement Specifications 4 2 24 Measurement Range in Voltage Per 4 2 2 and 4 2 3 Measurement Range in Current Per 4 2 5 and 4 2 6 Harmonic Range AC harmonics of orders 1 to 25 AC DC all orders from 1 to 25 plus the DC component Frequency Analysis Band 0 to 25 times the fundamental frequency from among the network frequencies 50 60 and 400Hz 0 to 12 times...

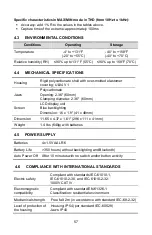
Page 57: ...een LCD display unit Blue backlighting Dimension 1 6 x 1 9 41 x 48mm Dimension 11 65 x 4 37 x 1 61 296 x 111 x 41mm Weight 1 4 lbs 640g with batteries 4 5 POWER SUPPLY Batteries 4x1 5V AA LR6 Battery Life 350 hours without backlighting and Bluetooth Auto Power Off After 10 minutes with no switch and or button activity 4 6 COMPLIANCE WITH INTERNATIONAL STANDARDS Electric safety Compliant with stand...

Page 58: ... R 1 ct 1 R 1 ct 5 R 1 ct Position of the conductor in the jaws f 400 Hz Any position on the internal perimeter of the jaws A W 2000A DC or 1400A AC 2000A DC 2 R 8 R 4 R 1 ct Full scale Adjacent conductor carrying a current of 150 A DC or RMS Conductor touching the external perimeter of the jaws A W 40 dB 30 dB Conductor enclosed by the clamp 0 to 500 A DC or RMS V 1 ct 1 ct Application of a volta...

Page 59: ...th a damp cloth and dry quickly using a dry cloth or forced air Dry completely before putting back into use 5 3 BATTERY REPLACEMENT The symbol indicates that the batteries are low When this symbol appears on the display unit the batteries must be replaced The measurements and specifications are no longer guaranteed To replace the batteries proceed as follows 1 Disconnect the measurement leads from...

Page 60: ...ation certificate plus recorded calibration data Chauvin Arnoux Inc d b a AEMC Instruments 15 Faraday Drive Dover NH 03820 USA Tel 800 945 2362 Ext 360 603 749 6434 Ext 360 Fax 603 742 2346 or 603 749 6309 repair aemc com Or contact your authorized distributor Costs for repair standard calibration and calibration traceable to N I S T are available NOTE All customers must obtain a CSA before return...

Page 61: ...ur warranty registration information on file or a proof of purchase AEMC Instruments will at its option repair or replace the faulty material REGISTER ONLINE AT www aemc com 9 WARRANTY REPAIRS What you must do to return an Instrument for Warranty Repair First request a Customer Service Authorization Number CSA by phone or by fax from our Service Department see address below then return the instrum...

Page 62: ......

Page 63: ......

Page 64: ...Chauvin Arnoux Inc d b a AEMC Instruments 15 Faraday Drive Dover NH 03820 USA www aemc com 99 MAN 100371 v12 03 20 ...

Reviews: