10
| ENGLISH
Each color line on the graph represents a different port. If you wish
to change the color for a port, mouse over the port and right-click.
You can hide a port from the graph by clicking on the circle to the
left of the port’s name. To re-enable its line on the graph, simply click
on the circle again.
To “zoom in” to a specific time range on the graph to see more detail,
use the “+” and “-” circles at the bottom right of the graph. You can
also “pinch to zoom” if you have a touchpad or use your mouse’s
scroll wheel to zoom in and out. Use the slider that appears at the
bottom of the graph to find a particular time range.
ENVIRONMENT GRAPH
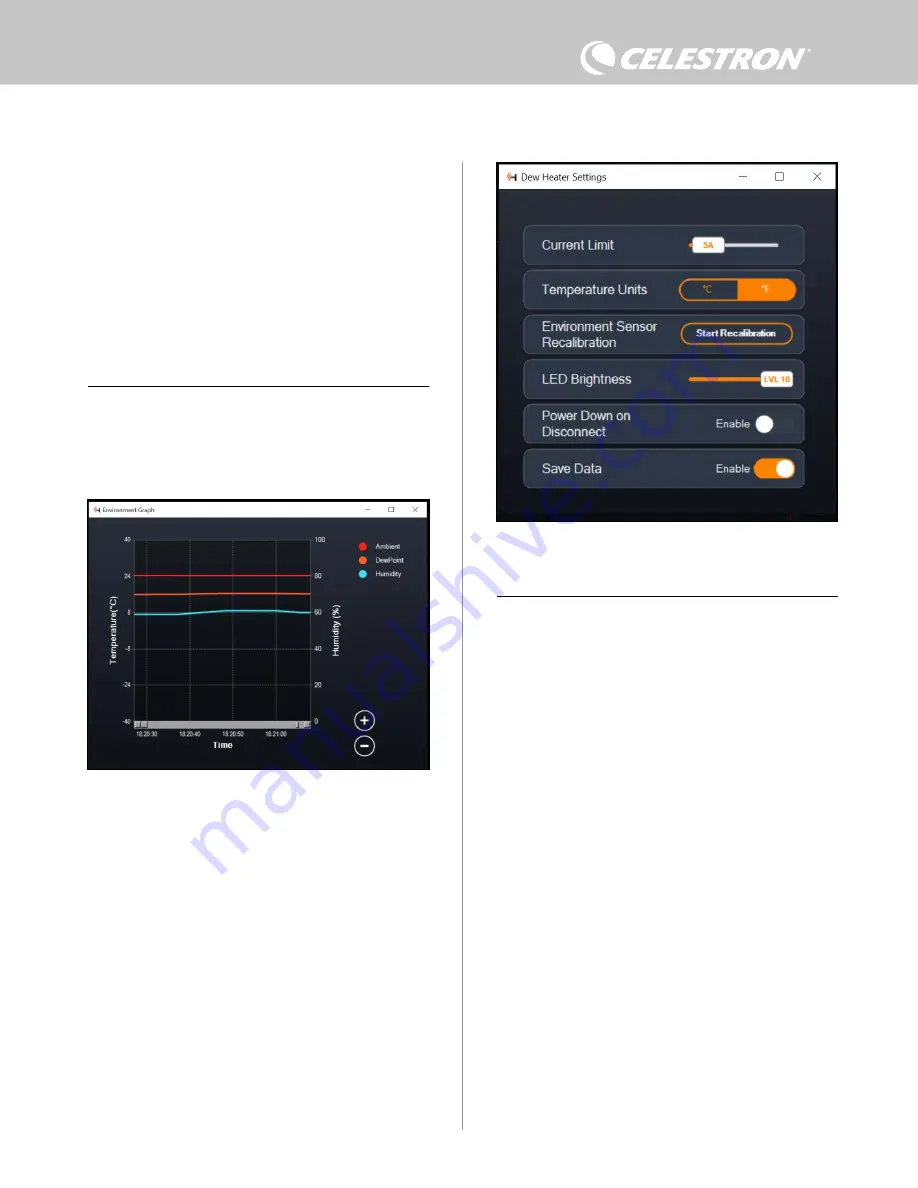
Select “Environment Graph” from the Dew Heater menu to bring up
the Environment Graph window (Figure 18). You can also access the
Environment Graph directly from the Overview screen by clicking on
the shortcut arrow icon next to the word “Environment” on the left
side of the Overview screen.
This graph shows the ambient air temperature, humidity, and
calculated dew point over time. The air temperature and dew point
use the temperature scale on the left of the graph. Humidity uses
the % humidity scale on the right of the graph. Each color line on the
graph represents a different value.
If you wish to change the color for a value, mouse over it and right-
click. You can hide a value from the graph by clicking on the circle to
the left of the value’s name on the graph. To re-enable its line on the
graph, simply click on the circle again.
To “zoom in” to a specific time range on the graph to see more detail,
use the “+” and “-” circles at the bottom right of the graph. You can
also use “pinch to zoom” if you have a touchpad or use your mouse’s
scroll wheel to zoom in and out of time ranges. Use the slider that
appears at the bottom of the graph to find a particular time range.
To change temperature units from degrees Fahrenheit (default)
to degrees Celsius, use the “Settings” selection from the Dew
Heater menu.
SETTINGS
The “Settings” selection from the Dew Heater menu brings up the
Dew Heater Settings window (Figure 19).
- Current Limit
l
Use the slider to set the maximum current for the power supply
you are using. If the power draw from the controller exceeds
the set max current, the “Over Current” LED on the controller
enclosure’s bridge will light up. If this occurs, you will need to
reduce the power draw by turning down or turning off devices
connected to the controller. (Alternatively, you can use another
power supply capable of providing more current. If you do this,
make sure to adjust the current limit accordingly.)
- Temperature Units
l
Change the units of temperature in CPWI using the °C and
°F buttons.
- Environment Sensor Recalibration
l
Use the “Start Recalibration” button to recalibrate the
environmental sensor. This heats the sensor to evaporate
any moisture that has accumulated on it. Recalibration helps
provide the most accurate sensor readings. It takes about
10 minutes for the sensor to heat up and cool back down.
We recommend recalibrating the environmental sensor
periodically, especially if the sensor has not been used in a
while or has been stored in humid conditions. This will help
provide the most efficient power usage for the dew heaters.
n
If you check the ambient temperature or humidity
during recalibration, the display will report the
values last detected before recalibration began.
Fig 18
Environment Graph window
Fig 19
Dew Heater Settings window
Summary of Contents for 94036
Page 14: ...14 ENGLISH NOTES ...
Page 15: ...ENGLISH 15 NOTES ...
Page 30: ...14 FRANÇAIS NOTES ...
Page 31: ...FRANÇAIS 15 NOTES ...
Page 46: ...14 DEUTSCH HINWEISE ...
Page 47: ...DEUTSCH 15 HINWEISE ...
Page 62: ...14 ITALIANO NOTE ...
Page 63: ...ITALIANO 15 NOTE ...
Page 78: ...14 ESPAÑOL NOTAS ...
Page 79: ...ESPAÑOL 15 NOTAS ...


