


20010101
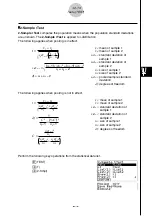
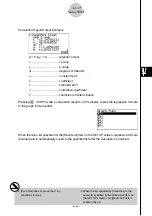
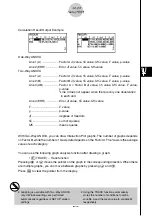
The following shows the meaning of each item in the case of list data specification.
Data ............................ data type
µ
1
................................. sample mean value test conditions (“
G
µ
2
” specifies two-tail
test, “<
µ
2
” specifies one-tail test where sample 1 is smaller
than sample 2, “>
µ
2
” specifies one-tail test where sample 1 is
greater than sample 2.)
List(1) .......................... list whose contents you want to use as data of sample 1
(List 1 to 20)
List(2) .......................... list whose contents you want to use as data of sample 2
(List 1 to 20)
Freq(1) ........................ frequency of sample 1 (1 or List 1 to 20)
Freq(2) ........................ frequency of sample 2 (1 or List 1 to 20)
Pooled ......................... pooling On (in effect) or Off (not in effect)
Save Res ..................... list for storage of calculation results (None or List 1 to 20)
Execute ....................... executes a calculation or draws a graph
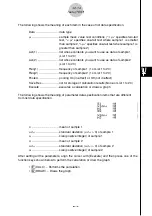
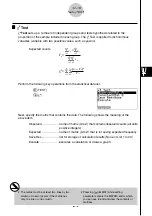
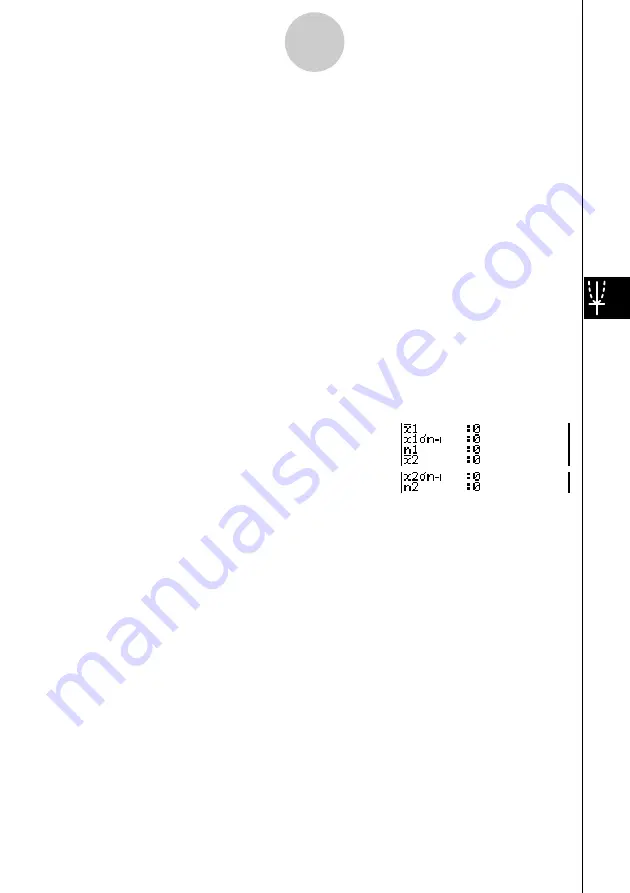
The following shows the meaning of parameter data specification items that are different
from list data specification.
o
1
................................. mean of sample 1
x
1
σ
n
-1
............................ standard deviation (
x
1
σ
n
-1
> 0) of sample 1
n
1
................................. size (positive integer) of sample 1
o
2
................................. mean of sample 2
x
2
σ
n
-1
............................ standard deviation (
x
2
σ
n
-1
> 0) of sample 2
n
2
................................. size (positive integer) of sample 2
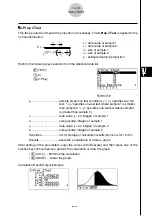
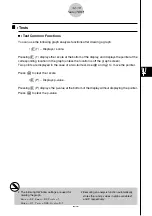
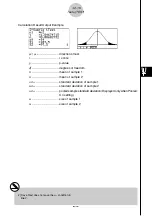
After setting all the parameters, align the cursor with [Execute] and then press one of the
function keys shown below to perform the calculation or draw the graph.
•
1
(CALC) ... Performs the calculation.
•
6
(DRAW) ... Draws the graph.
1-2-14
Tests (TEST)
20011101


