


3
3-34
Color Calibration
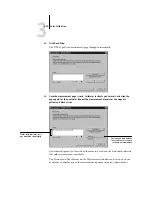
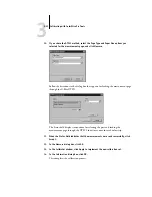
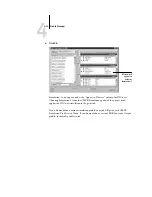
With the View Measurements option, you can view the current set of measurements as
a table or as a graph that shows both the measurements and the target curves (shown
below).
When more than one profile use the same target, an additional menu called Plot
Against appears at the top right of the window above. It lists all output profiles that use
that same calibration set. Selecting an output profile from this menu displays the target
curves associated with that profile. If each output profile contains a unique calibration
target, when you switch profiles, the curves displayed also change.
Output profile name
appears here
Summary of Contents for ColorPASS-Z5000
Page 1: ...ColorPASS Z5000 COLOR GUIDE I N C L U D E S F I E R Y S O F T W A R E ...
Page 2: ......
Page 6: ......
Page 96: ......
Page 148: ......
Page 160: ......
Page 172: ......
Page 175: ...Plate 1 Sunlight split into spectral colors by prism Plate 2 CIE chromaticity diagram ...
Page 179: ...Plate 5 Additive color model Plate 6 Color monitor ...
Page 180: ...Plate 7 Subtractive color model ...
Page 185: ...Plate 8 Color wheel Plate 9 Complements split complements and triads ...
Page 198: ......
Page 206: ......
Page 208: ......