


OBS-5+ System
2)
Click
Open
and select a file to view.
will print a graph
when
Open As Plot
is selected. To print a text file, select
Open As Text
,
and use the Word Pad file print functions. For spreadsheet operations, see
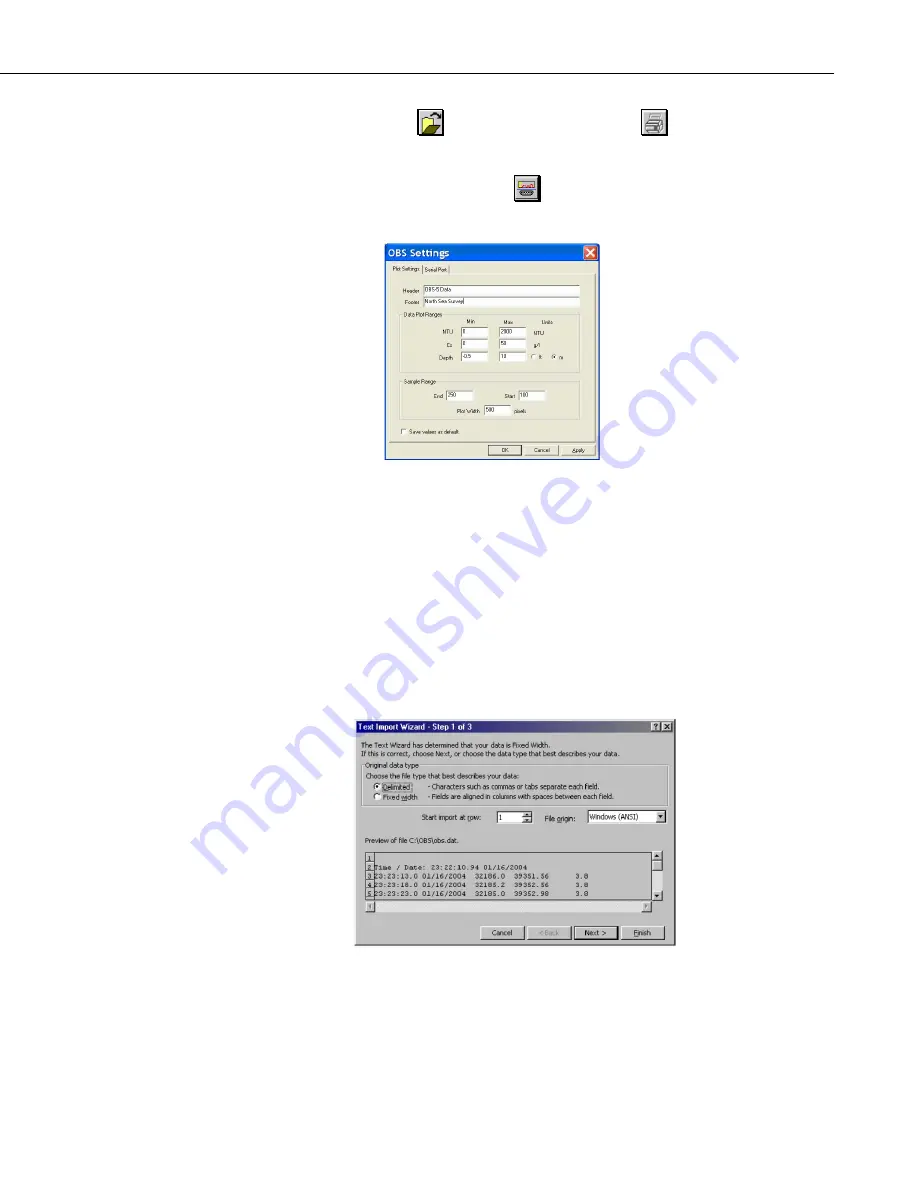
the next section. The
Plot and Port Settings
is used for setting up
your plot looks.
3)
Use the
Min
and
Max
and
Sample Range
(
End
and
Start
) values to
bracket the data you need on the graph.
Plot Width
allows the graph to be
sized to fit a PC screen. On the depth plot, select
Max
= 0 and
Min
= the
maximum depth to display depth increasing downward.
6.2.15 Excel Spreadsheets
To make an Excel spreadsheet from OBS-5+ data, start Excel and set file type
to
All
. Open a data file and select
Delimited
in Step 1 of 3 of the Text Import
Wizard. Click
Next >
and select the delimiter
Space
; check
Treat consecutive
delimiters as one
; and {none} for
Text qualifier
. In Step 3 of 3, select the
General Column data format
and click
Finish
.
19
Summary of Contents for OBS-5+
Page 2: ......
Page 8: ...Table of Contents iv ...
Page 50: ...Appendix A Turbidity Standards A 4 ...
Page 51: ......


