80
53-1002752-01
Fabric Watch Administrator’s Guide
Examples of the sysMonitor command
8
CPU and memory
When configuring CPU monitoring, specify a value in the 1-100 range. When the CPU usage
exceeds the limit, a Fabric Watch alert is triggered. The default CPU limit is 75 percent.
When configuring memory, the limit specifies a usage limit as a percentage of available resources.
When used to configure memory monitoring the limit value must be greater than the low limit and
smaller than the high limit.
The following operands are valid only with the --config mem command. Three thresholds are
supported for memory monitoring:
•
high_limit— Specifies an upper usage limit for memory as percentage of available memory.
This value must be greater than the value set by the -limit parameter. The maximum is 90
percent. When memory usage exceeds this limit, Fabric Watch generates a CRITICAL RASlog
message. The default is 80 percent.
•
limit—Specifies the default CPU limit. When the limit is exceeded, Fabric Watch sends out a
RASlog WARNING message. When usage returns below the limit, Fabric Watch sends a RASlog
INFO message. Valid values are range between 0 to 80 percent and the default value is
different for different systems.
•
low_limit—Specifies a lower usage limit for memory as percentage of available memory. This
value must be smaller than the value set by the -limit parameter. When memory usage exceeds
or falls below this limit, Fabric Watch generates an INFO RASlog message. The default for all
platforms is 50 percent.
Examples of the CPU and memory commands
The following sections provides specific examples for CPU and memory.
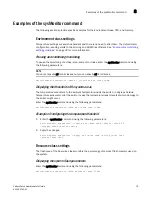
Displaying the current CPU usage threshold
Enter the sysMonitor command using the following parameters:
switch:admin> sysmonitor
--
show cpu
CPU Usage : 2%
CPU Usage Limit : 75%
Number of Retries :3
Polling Interval : 120 seconds
Actions: snmp
Displaying the current memory usage threshold
Enter the sysMonitor command using the following parameters:
switch:admin> sysmonitor --show mem
Used Memory: 171476k 34%
Total Memory: 504344k
Free Memory: 332868k
Used Memory Limit: 60%
Low Used Memory Limit: 40%
High Used Memory Limit: 70%
Polling Interval: 10 seconds
No Of Retries: 1
Actions: snmp,raslog
Summary of Contents for Fabric Watch
Page 10: ...x Fabric Watch Administrator s Guide 53 1002752 01 ...
Page 12: ...xii Fabric Watch Administrator s Guide 53 1002752 01 ...
Page 14: ...xiv Fabric Watch Administrator s Guide 53 1002752 01 ...
Page 38: ...18 Fabric Watch Administrator s Guide 53 1002752 01 Fabric Watch alarm behavior 2 ...
Page 42: ...22 Fabric Watch Administrator s Guide 53 1002752 01 Fabric Watch classes areas and elements 3 ...
Page 56: ...36 Fabric Watch Administrator s Guide 53 1002752 01 Notification configuration 5 ...

