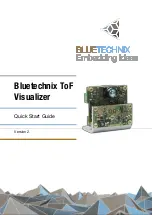
Quick Start Guide - Bluetechnix ToF Visualizer
Last change: 7 May 2015
Version 2
© Bluetechnix 2015
Page | 9
3.2
Bluetechnix ToF Visualizer
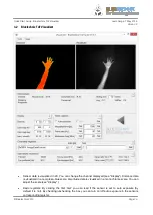
Sensor data is visualized in 2D. You can change the channel displayed (see “Display”). Distance data
is visualized in a red-green-blue scale. Amplitude data is visualized in a monochrome scale. You can
adjust the scale (see “Display”).
Basic registers: By clicking the first ‘Get’ you can read if the sensor is set to auto exposure (by
default it is not). By checking/unchecking the box you can turn on/off auto exposure in the sensors
corresponding register.

