


31
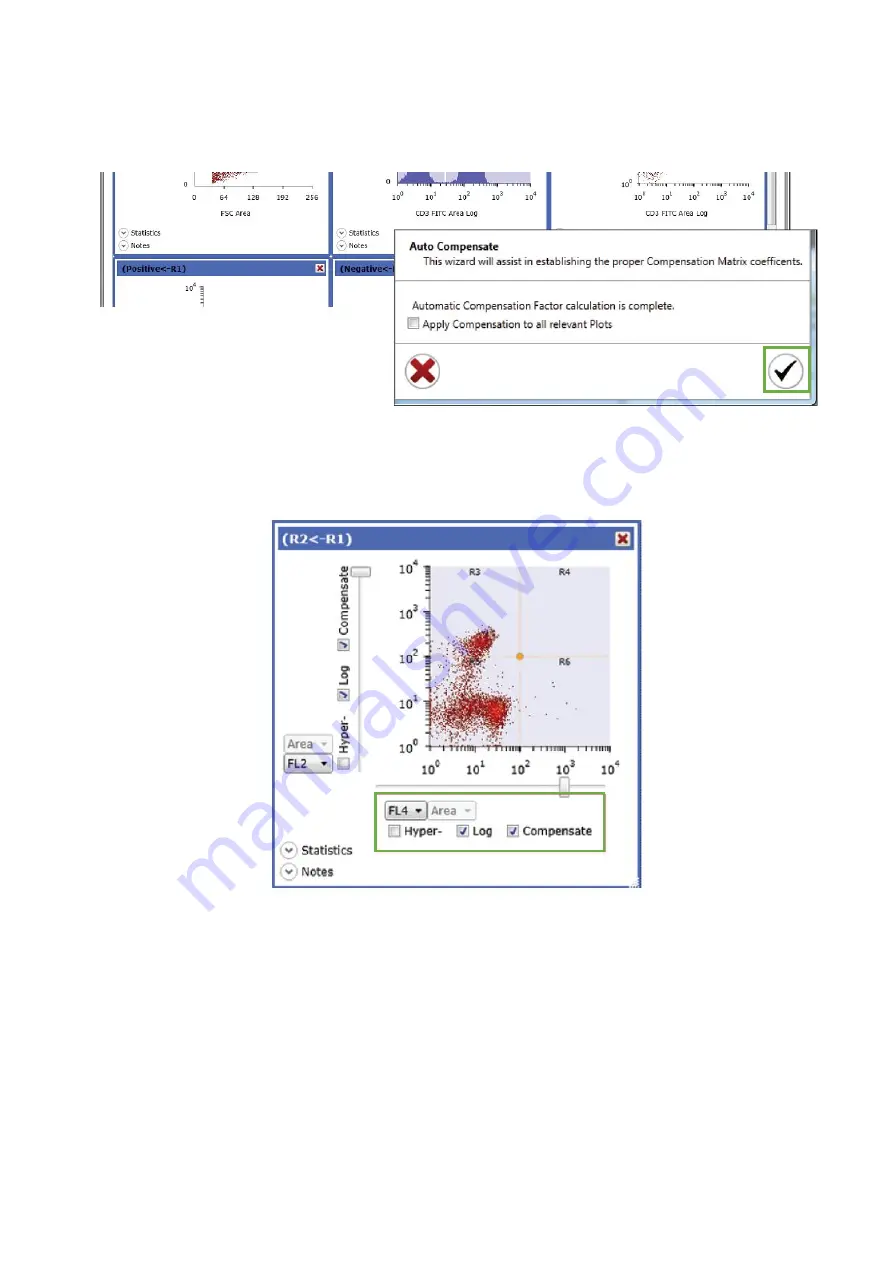
12. After all controls are adjusted, click the checkmark button. This will complete the
automatic compensation calculation
13. Check the compensation box on the axis of the desired histogram or density plot
to display either the compensated, acquired or sort data
14. The compensation matrix may be viewed at this point if desired
The hyper log feature allows data that have values lesser than zero to be correctly
displayed. This data display format is used only for compensated data. It converts a small
portion of the scale around zero to linear and adds a small amount of negative log scaling
to each access, preventing negative events from piling up on the axis. This allows better
visualization of compensated data.
Note that the
area parameter is greyed out and cannot be changed because
compensate is checked. Compensation can only be applied to area or height depending
on which selection was chosen during auto compensation.


