-17-
For more information on emissivity, please see glossary section 7,
Emissivity
)
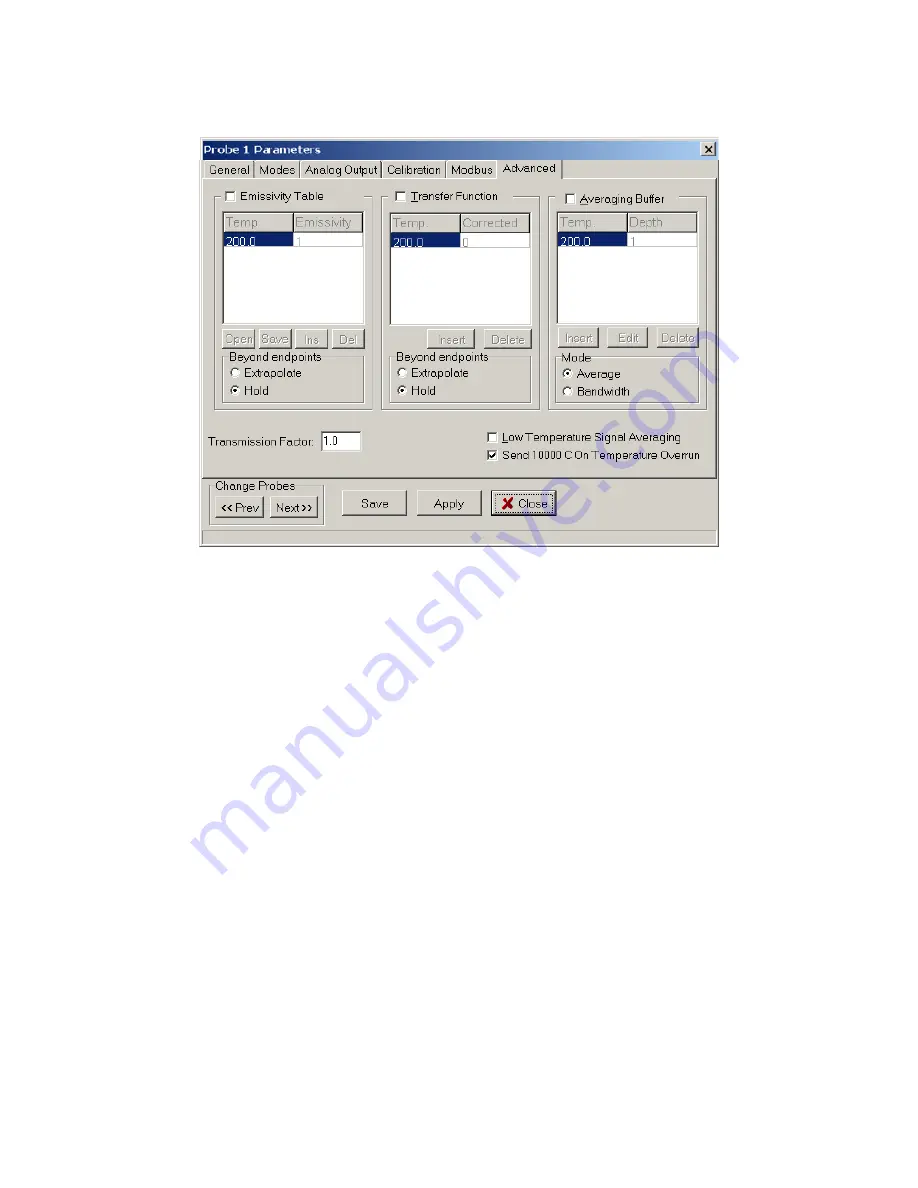
Figure 11: Advanced functions tab.
It is recommended that only small step changes in emissivity be entered. Entering more rows
with smaller changes in temperature and emissivity will generally provide better results and less
chance of errors.
Transfer Function:
The Transfer Function table allows the user to force the temperature
readings to agree with the values mapped into the table. The table can be edited, or rows can be
added or deleted using the buttons below the table. This feature can be turned on or off by
checking the box above the table.
The table may include one row or as many as eight (8) rows to map temperature corrections
verses measured temperature. The table can be edited, or rows can be added or deleted using the
buttons below the table. By checking the
Hold
or
Extrapolate
buttons below the table, the user
can select whether the Transfer Function correction will be held at the last entries or linearly
extrapolated beyond the last entries; the user should verify the extrapolation makes physical
sense.
Averaging Buffer / Bandwidth Table:
The
Averaging Buffer
allows the user to average several raw readings into the temperature that
is displayed and stored. If the values in the table are set to 1, or the check box enabling the
feature is not checked, then there is no averaging. The number of data points averaged into a
reading is in the right column of the Averaging table (marked Depth). Acceptable averaging
values are selected by clicking
Insert
, entering a temperature in the temperature box and then
selecting an averaging value from the pull down menu in the Depth Value box. The Averaging
feature can be turned off by removing the check in the box above the table. The averaging depth
will combine with the measurement rate to give the effective time over which the measurements
will be averaged.


