


Select Vibration Characteristic (1)
Use
Select Vibration Characteristic
to graph raw data.
Options include: Z-Axis Velocity, Z-Axis High Frequency Acceleration, X-Axis Velocity, and X-Axis High Frequency
Acceleration. The bottom left of the screen shows a real-time readout of the selected characteristic. Velocity is displayed in
in/s (mm/s for Vibemetric versions) and acceleration is displayed in g. Note: Velocity values of 6.5535 and/or acceleration
values of 5.355 indicate a sensor error. The system ignores these data points to avoid affecting the saved baseline or
trended data. The system will not baseline when the raw data values appear as those values. Contact Banner support for
troubleshooting.
Time Scale (2)
Select the
Time Scale
of the graph from 1 to 168 total hours.
Use the arrow keys to scroll right or left to see different periods of the collected data. The maximum viewable data on the
HMI is 168 hours or 7 days. The graphing data loggers have a fixed number of data points. If you are using the DEMO
MODE button on the Settings page, the increased sample rate reduces the number of data points available for viewing until
those data points have rolled off the end of the timeline.
Scale Maximum (3)
Select the data
Scale Maximum
. For acceleration, the range is 0.25 g to 5 g (g-force). For velocity, the range is 0.5 in/s to
5 in/s (10 mm/s to 60 mm/s for metric versions).
Current Alerts (4)
The
Current Alerts
section shows any warnings or alarms based on the Axis, Vibration Characteristic, and type (Chronic or
Acute) that the system is detecting.
Acute alerts are those crossing the threshold for five samples in a row (or the user setting on the Settings screen) and
Chronic alerts are when a 100 point moving average crosses the thresholds. Only data from an operational asset is used to
calculate averages and alerts.
Select Temperature (5)
Use
Select Temperature
to view the temperature graph over the selected time period.
Directly above the button is the current temperature in degrees Fahrenheit of the selected Node. The readout color is white
if it’s nominal, yellow if it’s in a warning state, and red if it’s in an alarm state. The warning and alarm temperature settings
are 158 °F and 176 °F respectively. A raw temperature value of 327.67 indicates a sensor error. Contact Banner's technical
support for troubleshooting.
Select Current (6)
Use
Select Current
to view the current graph over the selected time period.
Directly to the right of the button is the raw current reading in Amps of the selected Node. The readout color is white if it’s
normal, yellow if it’s in a warning state, and red if it’s in an alarm state. Requires the use of the Banner CM1L Condition
Monitoring VT/CT node. This option only appears if
Enable Current Measurements
is turned on within the
Settings
screen. Warning and alarm settings are set on the
Current Alarm Settings
screen within the
Settings
page.
In the upper right corner of the screen is the Sensor's Modbus ID and the radio ID to which the sensor is attached. This can be
useful in finding which radio a sensor is connected to if the orange Out of Sync status icon appears. Signal quality or battery
replacement may be necessary for a radio that loses connection status.
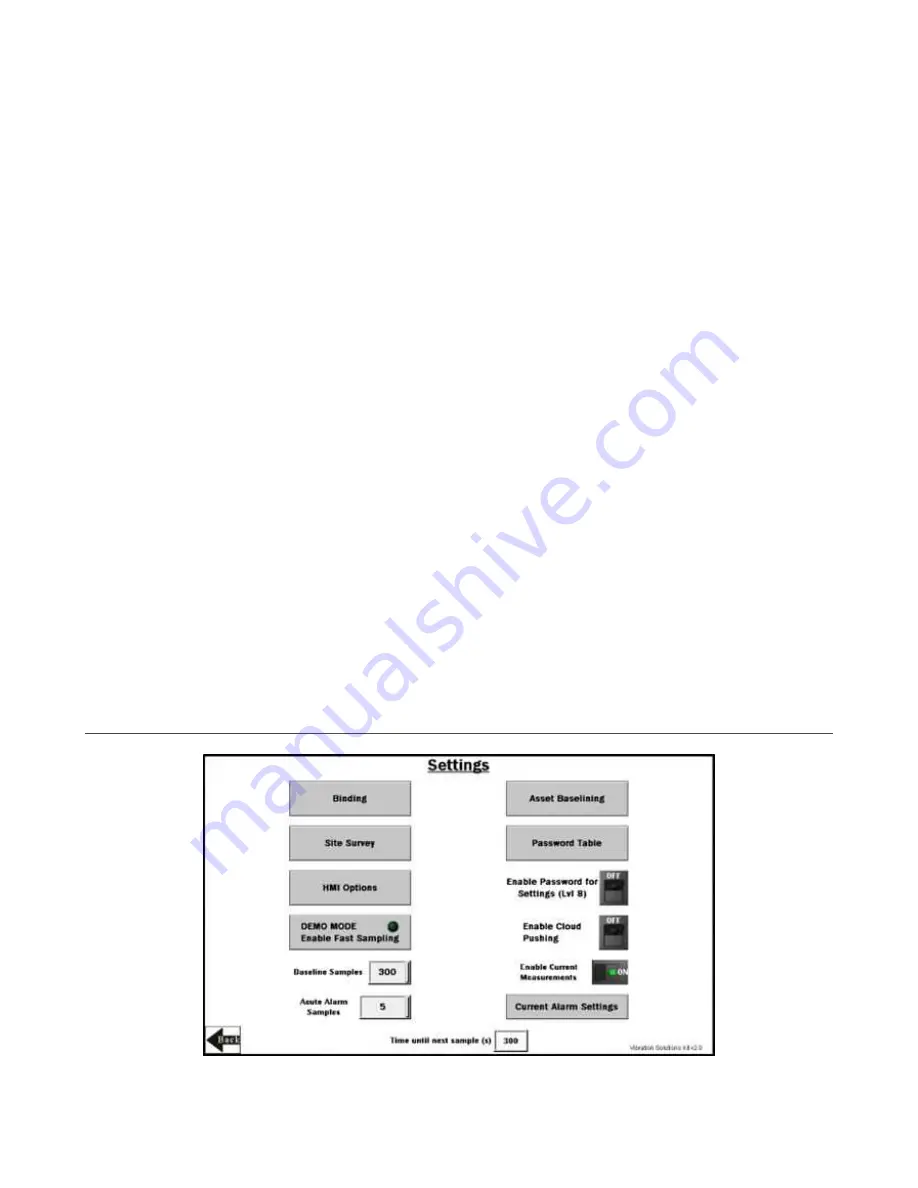
Settings Screen
Vibration Monitoring and Predictive Maintenance Solutions Kit Quick Start Guide (MultiHop)
P/N 214301 Rev. F
www.bannerengineering.com - Tel: + 1 888 373 6767
5


