


Burn Navigator® User’s Manual
Page 25
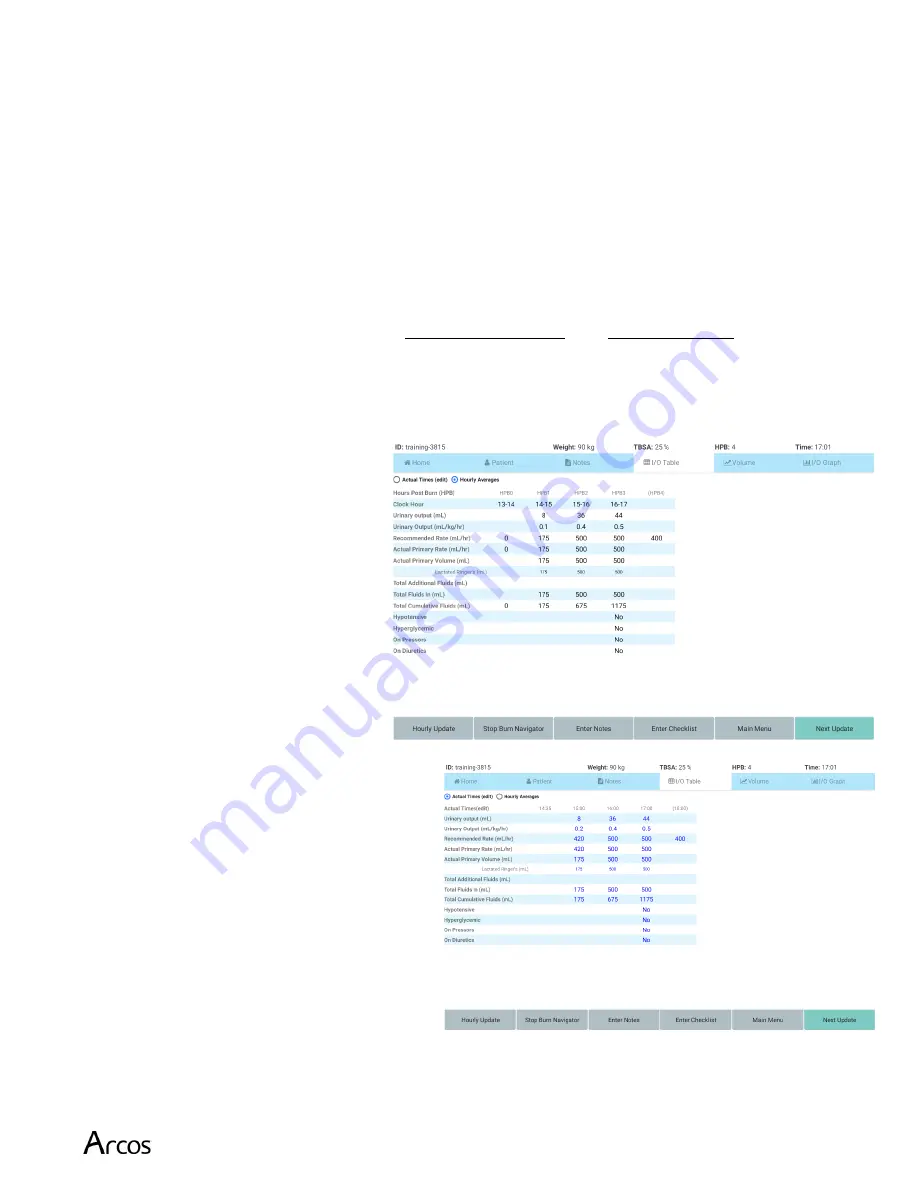
I/O Table
The I/O Table shows all the fluid information for the patient.
On the left of the screen is a list of fluids and other information: the UO (in mL and in
mL/kg/hr), Recommended Rate for that time period, Actual Primary Fluids given to the
patient, and Total Additional Fluids. The bottom rows show whether the patient is
hypotensive, on pressors, or on diuretics, if those safety questions were asked during the
fluid update.
Note
: the safety questions are not asked each hour; they are asked only when the
recommendation algorithm wants to decrease the fluid rate.
There are two views of the I/O Table:
Hourly Averages
and
Actual Times
Hourly fluid updates should happen at the top of each hour (when the clock reads __:00), but
you may be a few minutes late. The Burn Navigator will accept data even if it the data is not
at the top of the hour. We generate two views of the I/O Table:
1)
Hourly Averages
(on the
right) indicates where the
software averages the data you
provide to fit into the fixed 60-
minute hour post burn periods,
e.g., from 02:00 to 03:00, 03:00
to 04:00, etc.
In the Hourly Averages view,
each column represents exactly
60 minutes, matching clock
hours.
2)
Actual Times
(on the right)
indicates the values entered for the
actual time period of the update. For
example, the screen on the right
shows one fluid update period
ending at 11:01, one minute after the
top of the hour.
In Actual Times view, a column
might represent any number of
minutes (60, 72, 53, etc.) depending
on when the updates were actually
entered.


