


14
®
ArC Instruments Ltd.
Manual Write Pulsing
In the
Manual Pulsing
sub-panel, single WRITE pulses can be applied on a selected device.
Click the
+Pulse
to immediately apply a positive voltage pulse, and
–
Pulse
to apply a negative pulse.
The parameters of the pulse, such as amplitude and duration, can be changed via the entry fields
above the corresponding buttons.
A READ operation is automatically performed after each manual pulse. The new measurement is
added in the
Data Plot
panel, along with the applied manual pulse.
Checking the
Lock
checkbox disables the negative pulse parameter entry fields. Clicking
–
Pulse
will
then apply a negative pulse with the parameters of the positive pulse entry fields.
For example: positive pulse parameters are 1V 100ms, negative pulse parameters are 2V 1ms. Clicking
+Pulse
will apply 1V 100ms,
-Pulse
will apply 2V 1ms. After checking the Lock checkbox, clicking
+Pulse
will apply 1V 100ms, and
–
Pulse
will apply -1V 100ms.
Data Display
In the Display Options sub-panel, the user can modify the plot options in the Data Plot panel.
Press Full to display all recorded data points for the selected device.
Press Range to display the last X number of points, where X is set in the adjacent counter.
Tick the log Y checkbox to set logarithmic Y axis in the top subplot of the Data Plot panel.
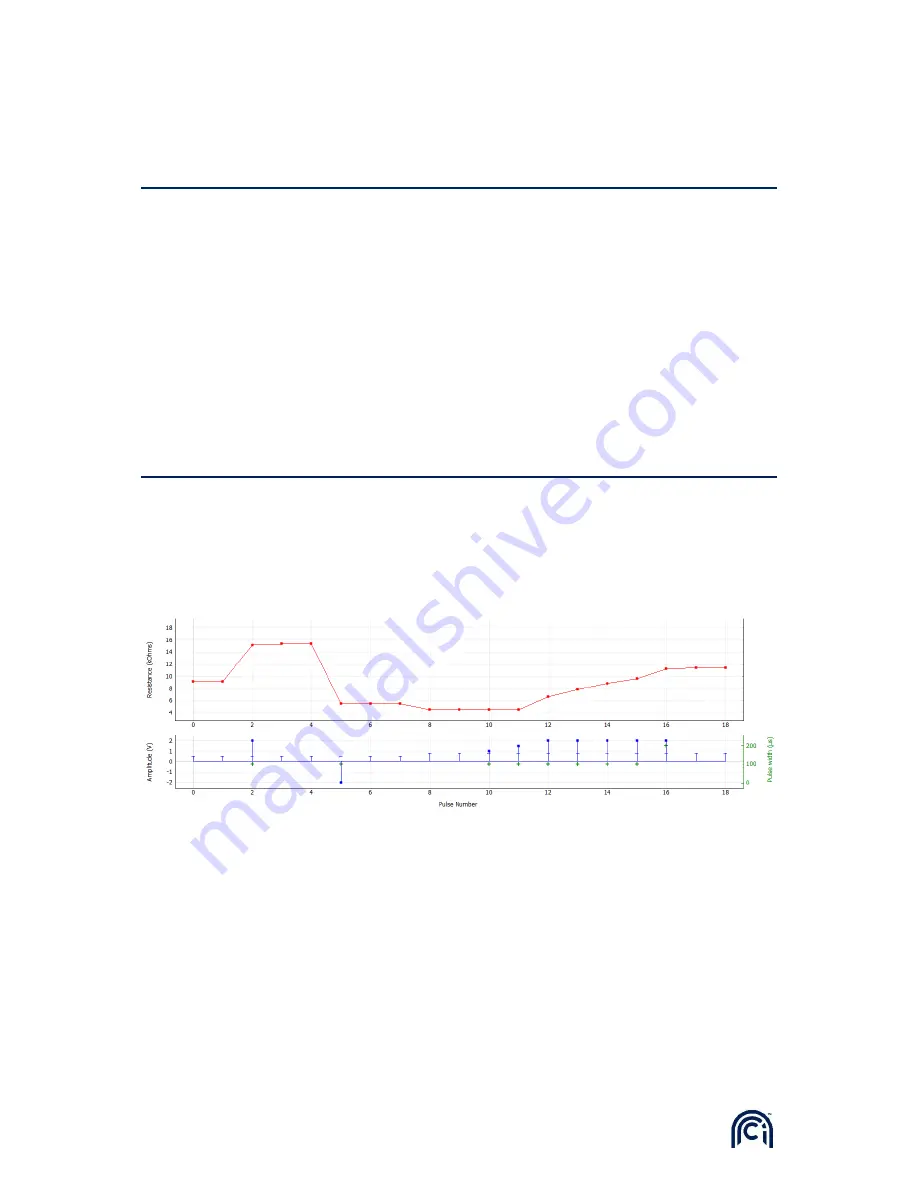
Understanding the Data Plot panel.
Top subplot shows read value of resistance at each pulse number.
Bottom subplot shows:
-
Blue horizontal line marker shows the voltage at which the respective resistance data point
was measured at.
-
Blue square marker shows a WRITE voltage pulse amplitude
-
Green ‘+’ marker shows the pulse width of a WRITE voltage pulse, shown on the right hand
side Y axis.
A WRITE pulse followed by a READ pulse are displayed in the same pulse number on the x-axis: a blue
square marker showing the WRITE pulse amplitude, and a blue horizontal line showing the read
voltage of the consecutive READ pulse. The resulting value of resistance measured during the
respective READ pulse is shown in the corresponding pulse number data point in the top subplot.
Figure 14: TIA-based read schematic illustration.
Figure 16: Example of a data plot showing evolution of resistance during an arbitrary manual pulsing session.
Figure 15: Example Data Plot