background image

EVAL-AD7276SDZ User Guide 

UG-450 


Rev. 0 | Page 15 of 20 

OVERVIEW OF THE MAIN WINDOW 

The main window of the software is shown in Figure 15 and has 
the features described in this section. 

File Menu (Section 1) 

The File menu (labeled 1 in Figure 15) offers the choice to 


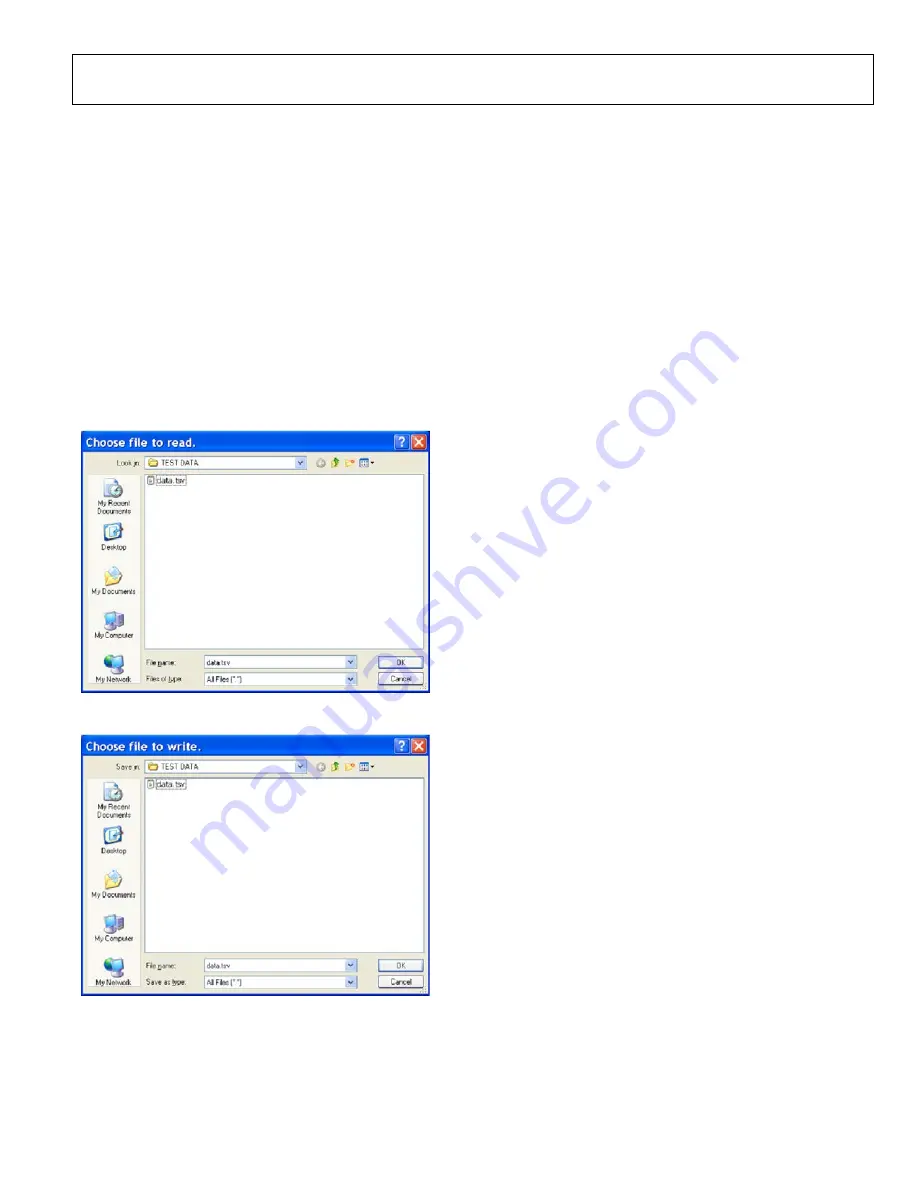
Load data: load previously captured data or example files in 
.tsv (tab separated values) format for analysis (see Figure 16). 
(The default location for example files is C:\Program 
Files\Analog Devices\EVAL-AD7276_77_78SDZ
.) 


Save Data as .tsv: save captured data in .tsv format for 
future analysis (see Figure 17). 


Print Front Panel Picture: print the main window to the 
default printer. 


Save Picture: save the current screen capture. 


Exit: quit the application. 


Figure 16. Load File Dialog Box: 

Loading Previously Captured Data or Example Files in .tsv Format 


Figure 17. Save File Dialog Box: 

Saving Data as .tsv 

Part Information Box (Section 2) 

The Part Information box (labeled 2 in Figure 15) displays the 

generic being evaluated and is for informational purposes only. 

Resolution Box (Section 3) 

The Resolution box (labeled 3 in Figure 15) displays the 
resolution of the 

AD7276

 in bits. 

Sampling Rate Box (Section 4) 

The default sampling frequency in the Sampling Rate box 
(labeled 4 in Figure 15) matches the maximum sample rate of 
the ADC being evaluated. Although you can adjust the sampling 
frequency, there are limitations in terms of the sample frequencies 
that can be entered. If an unusable sample frequency is input, the 
software automatically adjusts the sample frequency accordingly. 
Units can be entered as, for example, 10k for 10,000 Hz. The 
software automatically adjusts the sample frequency according 
to the ability of the ADC being evaluated. For example, if you 
enter a value that is beyond the ability of the device, the software 

indicates this and reverts to the maximum sample frequency.  

Exit Button (Section 5) 

Clicking Exit (labeled 5 in Figure 15) closes the software. 
Alternatively, you can select Exit from the File menu. 

Busy LED (Section 6) 

The Busy LED (labeled 6 in Figure 15) indicates when a read 

from the 

EVAL-SDP-CB1Z

 board is in progress.  

Tabs Area (Section 7) 

There are four tabs available in the tabs area (labeled 7 in Figure 15) 
of the main window: WaveformHistogramFFT, and Summary
These tabs display the data in different formats. Navigation tools 
are provided within each tab to allow you to control the cursor, 

zooming, and panning (see Figure 15) within the graphs displayed. 
Each tab is described in more detail in the Generating a 
Waveform Analysis Report; Generating a Histogram of the 
ADC Code Distribution; Generating a Fast Fourier Transform 
of AC Characteristics; and Generating a Summary of the 

Waveform, Histogram, and Fast Fourier Transform sections.  

# Samples Box (Section 8) 

The # Samples box (labeled 8 in Figure 15) allows you to select 
the number of samples to analyze. When Sample or Continuous 
is clicked, the software requests this number of samples to be taken. 

This is the total number of samples taken on all channels.  

Sample Button (Section 9) 

Clicking Sample (labeled 9 in Figure 15) performs a single 
capture, acquiring a set number of samples at the selected 

sampling rate. 

Continuous Button (Section 10) 

Clicking Continuous (labeled 10 in Figure 15) performs a 
continuous capture from the ADC. Clicking Continuous a 

second time stops sampling. 


10941-

021

10941-

020

Summary of Contents for EVAL-AD7276SDZ

Page 1: ...upply and features throughput rates of up to 3 MSPS The part contains a low noise wide bandwidth track and hold amplifier that can handle input frequencies greater than 55 MHz The evaluation board can be controlled via the system demon stration platform SDP The EVAL SDP CB1Z board allows the evaluation board to be controlled via the USB port of a PC using the AD7276 evaluation software The EVAL AD...

Page 2: ...guration Options 9 Setup Conditions 9 Evaluation Board Circuitry 11 Analog Inputs 11 Reference Options 11 Sockets Connectors 11 Modes of Operation 12 SDP Controlled Mode 12 Standalone Mode 12 How to Use the Software for Evaluating the AD7276 13 Setting Up the System for Data Capture 13 Overview of the Main Window 15 Generating a Waveform Analysis Report 16 Generating a Histogram of the ADC Code Di...

Page 3: ... boards together using the nylon screw nut set included in the evaluation board kit to ensure that the boards are connected firmly together 3 Connect the 9 V power supply adapter included in the evaluation board kit to Connector J1 on the EVAL AD7276SDZ board 4 Connect the EVAL SDP CB1Z board to the PC using the supplied USB cable If you are using Windows XP you may need to search for the EVAL SDP...

Page 4: ...th the EVAL SDP CB1Z board disconnected from the USB port of the PC insert the installation CD into the CD ROM drive 2 Double click the setup exe file to begin the evaluation board software installation The software is installed to the following default location C Program Files Analog Devices EVAL AD7276_77_78SDZ AD7276 3 A dialog box appears asking for permission to allow the program to make chan...

Page 5: ...monstration Platform Board Drivers After the installation of the evaluation board software is complete a welcome window is displayed for the installation of the EVAL SDP CB1Z system demonstration platform board drivers 1 With the EVAL SDP CB1Z board still disconnected from the USB port of the PC make sure that all other applications are closed and then click Next Figure 8 EVAL SDP CB1Z Drivers Set...

Page 6: ... drivers installation click Finish which closes the installation wizard Figure 11 EVAL SDP CB1Z Drivers Setup Completing the Drivers Setup Wizard 5 Before using the evaluation board you must restart your computer A dialog box opens giving you the following options Restart Shut Down Restart Later Click the appropriate button Figure 12 EVAL SDP CB1Z Drivers Setup Restarting the Computer 10941 010 10...

Page 7: ...valuation board and EVAL SDP CB1Z board to the USB port of the PC to ensure that the evaluation system is correctly recognized when it is connected to the PC Configuring the Evaluation and SDP Boards 1 Connect the EVAL AD7276SDZ board to Connector A or Connector B of the EVAL SDP CB1Z board see Figure 2 a Screw the two boards together using the nylon screw nut set included in the evaluation board ...

Page 8: ...alone mode see the Modes of Operation section for more information When the EVAL AD7276SDZ board is used in conjunction with the EVAL SDP CB1Z board SDP controlled mode connect the ac transformer to Connector J1 on the EVAL AD7276SDZ board The VDD AMP and AMP supplies are generated on board When the EVAL AD7276SDZ board is used in standalone mode the VDD and amplifier supplies must be sourced from...

Page 9: ...rminal 3 LK3 Bias up voltage selection Selects the voltage level that is supplied to U4 Position A the bias up voltage level that is supplied to U4 is VDD Position B the bias up voltage level that is supplied to U4 is 0 V LK4 VDD source selection Position A VDD is sourced from U5 Position B VDD is sourced externally via J4 LK5 U5 output voltage selection Inserted the U5 output voltage is 3 0 V Rem...

Page 10: ...ut impedance is 51 Ω LK7 A The CS signal is connected to EVAL SDP CB1Z LK8 Inserted The biased up input signal is connected to the U7 input buffer LK9 A The SCLK signal is connected to EVAL SDP CB1Z LK10 A The input signal is connected to the U7 input buffer LK11 Inserted The VIN input impedance is 51 Ω LK12 A The SDATA signal is connected to EVAL SDP CB1Z ...

Page 11: ...er Table 5 Bipolar Input Jumper Settings Link Jumper Settings LK11 Removed All Other Links Set as described in Table 3 REFERENCE OPTIONS The following on board reference supply is available AD780 2 5 V 3 0 V ultrahigh precision band gap voltage ref erence The reference is taken from the VDD pin of the AD7276 Alternatively an external reference voltage can be applied to J4 SOCKETS CONNECTORS Table ...

Page 12: ...g level shifters The EVAL SDP CB1Z operates at a 3 3 V logic level which allows logic voltages that exceed 3 3 V to be used without damaging the SDP interface STANDALONE MODE The EVAL AD7276SDZ can also be used without the EVAL SDP CB1Z controller board In this case the EVAL AD7276SDZ is connected to the digital interface using the SMB connectors as described in Table 7 Table 7 Standalone Jumper S...

Page 13: ...e list of System Tools see Figure 13 b Analog Devices System Development Platform 32MB should appear under ADI Development Tools indicating that the EVAL SDP CB1Z driver software is installed and that the board is connected to the PC correctly Figure 13 Device Manager Checking that the Board Is Connected to the PC Correctly Launching the Software After completing the steps in the Setting Up the Sy...

Page 14: ...er Guide Rev 0 Page 14 of 20 Figure 15 Evaluation Software Main Window 10941 015 CONTROL CURSOR CONTROL PANNING CONTROL ZOOMING NOTES 1 FOR DETAILS ABOUT THE AREAS HIGHLIGHTED IN RED SEE THE OVERVIEW OF THE MAIN WINDOW SECTION ...

Page 15: ...e 10k for 10 000 Hz The software automatically adjusts the sample frequency according to the ability of the ADC being evaluated For example if you enter a value that is beyond the ability of the device the software indicates this and reverts to the maximum sample frequency Exit Button Section 5 Clicking Exit labeled 5 in Figure 15 closes the software Alternatively you can select Exit from the File...

Page 16: ... ANALYSIS REPORT Figure 18 illustrates the waveform capture tab for a 50 kHz sine wave input signal The Waveform Analysis area labeled 1 in Figure 18 reports the amplitudes recorded from the captured signal and the frequency of the signal tone Figure 18 Waveform Tab 10941 016 ...

Page 17: ...k the Histogram tab from the main window 3 Click Sample Raw data is then captured and passed to the PC for statistical computations and various measured values are displayed in the Histogram Analysis area DC Input A histogram test of dc input can be performed with or without an external source because the evaluation board has a buffered VREF 2 source at the ADC input To perform a histogram test of...

Page 18: ...soidal signal applied b If a low frequency band pass filter is used when the full scale input range is more than a few volts peak to peak use the on board amplifiers to amplify the signal thus preventing the filter from distorting the input signal 2 Click the FFT tab from the main window 3 Click Sample As in the histogram test raw data is then captured and passed to the PC which performs the FFT a...

Page 19: ...WAVEFORM HISTOGRAM AND FAST FOURIER TRANSFORM Figure 21 shows the Summary tab The Summary tab captures all the display information and provides it in one panel with a synopsis of the information including key performance parameters such as SNR and THD Figure 21 Summary Tab 10941 019 ...

Page 20: ...s used herein the term Third Party includes any entity other than ADI Customer their employees affiliates and in house consultants The Evaluation Board is NOT sold to Customer all rights not expressly granted herein including ownership of the Evaluation Board are reserved by ADI CONFIDENTIALITY This Agreement and the Evaluation Board shall all be considered the confidential and proprietary informa...

Reviews: