UG-1820
Rev. 0 | Page 11 of 24
23999-
017
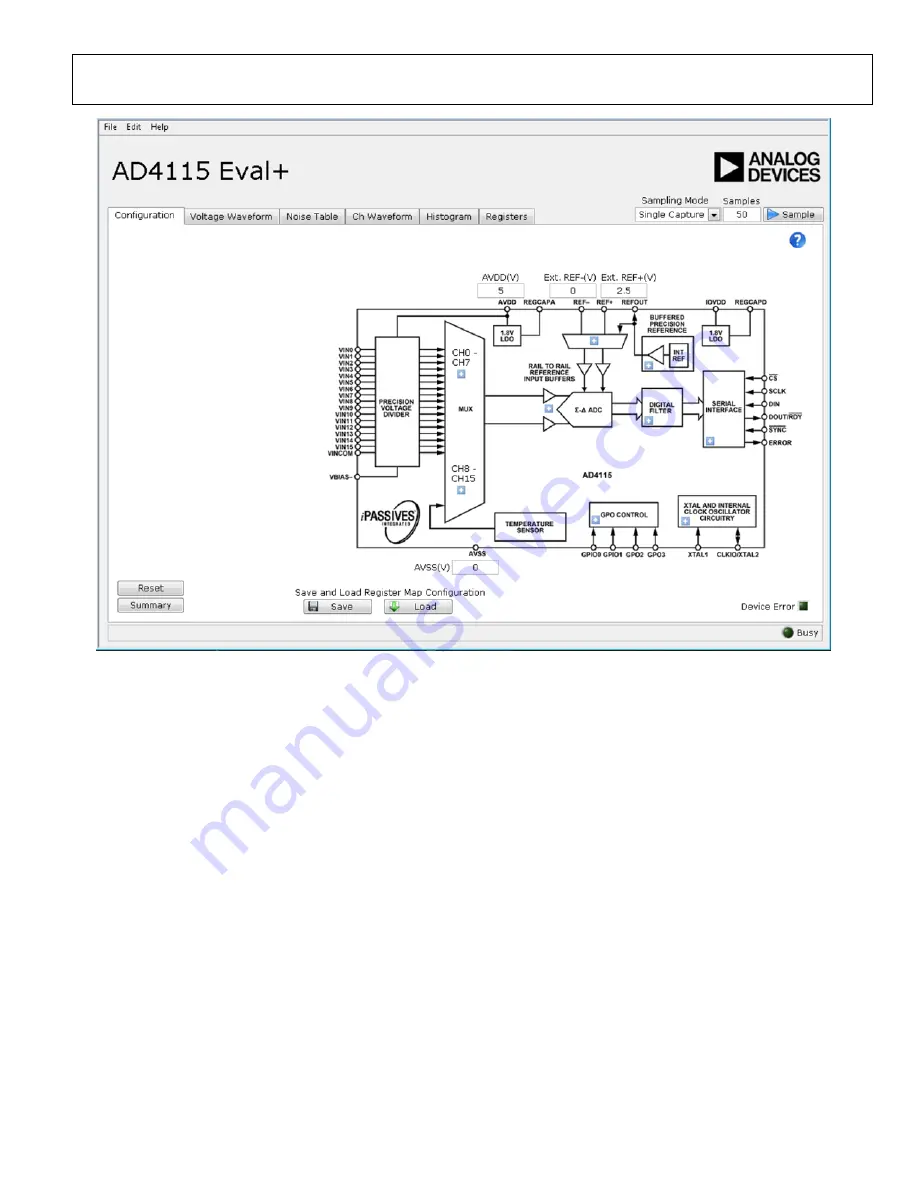
Figure 17.
Configuration
Tab in Advanced Mode
SOFTWARE OPERATION
Overview of the Main Window
After selecting
AD4115 Evaluation Board
, shown in Figure 13,
the main window of the evaluation software displays, as shown
in Figure 16. The
Configuration
tab shows the control buttons
and analysis indicators of the
software. The main
window of the
software in quick start mode
contains four tabs:
Configuration
,
Voltage Waveform, Noise
Table,
and
Histogram
.
In advanced mode, two additional tabs are available:
Ch Waveform
and
Registers
.
CONFIGURATION TAB
The
Configuration
tab shows a block diagram of the
This tab allows the user to select inputs, set up the ADC, reset the
ADC, view errors present, and configure the device for different
demonstration modes. Figure 16 shows the
Configuration
tab
in detail, and the following sections discuss the different
elements on the
Configuration
tab of the software window.
Inputs (Quick Start Mode Only)
The
has 16 voltage inputs that can be configured as
single-ended or fully differential pairs (Label 1 in Figure 16).
Use the
Vin0 - Vin7
and
Vin8 – V15
buttons to select between
inputs.
The voltage range can also be set per input to −10 V to +10 V,
−5 V to +5 V, 0 V to +10 V, or 0 V to +5 V. Changing the
appropriate voltage range provides more realistic values for
P - P
Resolution
and
RMS
Resolution
shown in the noise analysis
area (Label 23 in Figure 18).
Output Data Rate (ODR)/Measurement Time
The ODR can be set for all inputs in the
Configuration
tab
(Label 2 in Figure 16). Set the ODR by entering a value in hertz
into the
ODR(Hz)
box or a measurement time in milliseconds
into the
Time(ms)
box. If an ODR is entered, the software
calculates the measurement time. If a time is entered, the
software calculates the fastest ODR that can achieve the
required measurement time.


