AMD Processor Performance Evaluation Guide
30579 Rev. 3.74 March 2007
52
Benchmarking Results
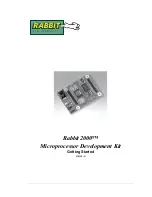
Figure 23. Dr. DivX Performance
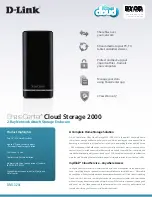
Figure 24. High Performance Gaming and Multimedia Performance¹
,
²
1. Computer gaming benchmarks may reveal the limitations of a graphics card and may not truly represent relative
processor performance.
2. This score is a composite of five tests. It is a geometric mean of normalized scores rather than a geometric mean of
absolute scores because City of Villains is scored in frames-per-second, while Media Encoder is scored in seconds.
100.0%
100.8%
108.6%
116.5%
50%
60%
70%
80%
90%
100%
110%
120%
AMD Athlon™ 64 FX-62
Dual-Core Processor
AMD Athlon 64 FX-70
Dual-Core Processor
AMD Athlon 64 FX-72
Dual-Core Processor
AMD Athlon 64 FX-74
Dual-Core Processor
100.0%
486.7%
522.1%
550.3%
0%
100%
200%
300%
400%
500%
AMD Athlon™ 64 FX-62
Dual-Core Processor
AMD Athlon 64 FX-70
Dual-Core Processor
AMD Athlon 64 FX-72
Dual-Core Processor
AMD Athlon 64 FX-74
Dual-Core Processor