


01-999124-00 J 0606
Dual and Dual Broadband NMR Probes Installation
11
Testing Probes on VnmrS and
UNITY
INOVA Systems
2.
Use the spectra and parameter set from the
1
H lineshape test. Plot the spectrum again
using a large enough value of
wp
to show all the spinning sidebands.
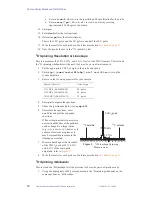
3.
Measure spinning sideband amplitudes as a percentage of the main peak.
Spinning sidebands occur at frequency intervals on either side of the central peak
equal to the spinning rate. The sidebands may not be split.
The standard test requires
nt=1
or
nt=4
. Do not repeat the test at
nt=16
if the
sideband specification is met at
nt=4
.
4.
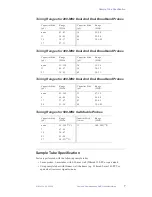
Write the results for each probe in the forms provided in
PFG Profile and Recovery
Run these tests for PFG capable probes. The profile test calibrates the G/cm-DAC units for
the user global real-valued parameter
gcal
.
PFG Profile
1.
Insert the 4 Hz D
2
O/H
2
O sample and tune the probe.
2.
Enter
rtp('/vnmr/tests/shmd2o') su
.
3.
Check the values of
tpwr
,
p1
, and
pw
:
p1
=
1
H 90° and
pw
=2*
p1
.
4.
Enter
profile
.
5.
Enter the appropriate value for
gzlvl1
:
• Performa I:
gzlvl1=250
• Performa II:
gzlvl1=4000
6.
Enter
ga
and acquire a spectrum.
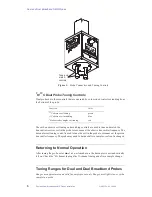
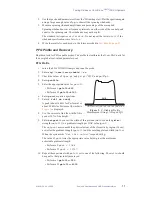
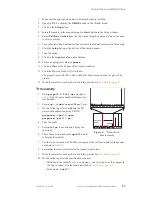
7.
Enter
f full dc vsadj
.
A peak (about 16 kHz for Performa I or
about 50 kHz for Performa II) similar to
is displayed.
8.
Use the cursors to find the width of this
peak at 20% of the height.
9.
Enter
setgcal
to convert the width of this plateau (
delta
) and the gradient
strength (
gzlvl1
) to a gradient strength per DAC value (
gcal)
.
The
setgcal
macro needs the physical extent of the rf sensitivity region (1.6 cm),
as well as the gradient strength (
gzlvl1
) and the resulting plateau width (
delta
).
When the system asks “
Set this value?
” respond with
y
.
The value of
gcal
times the appropriate value below gives the maximum
achievable gradient strength.
• Performa I:
gcal
×
2048
• Performa II:
gcal
×
32767
10. Repeat the experiment with
gzlvl1
set to one of the following. The
delta
should
be equal to that previously measured.
• Performa I:
gzlvl1=–250
• Performa II:
gzlvl1=–4000
Figure 3. Z-Gradient Profile
Measurement Using 1% Doped D
2
O
Hz
10000
20000
30000
40000
50000
60000
70000
80000
90000
delta